where a, b and c are coefficients in the real numbers. To begin with, lets look at the graph of the basic general form of a parabola
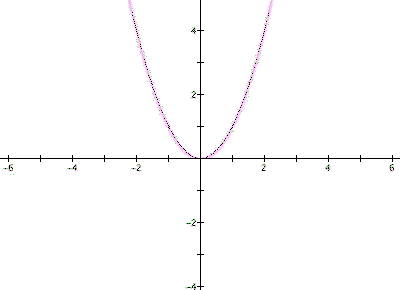
This graph demonstrates the most common parabola where a =1, b = 0 and c = 0. The next graph has the function

This function lets a = 2, b = 3 and c =-4. Lets explore how changing these coefficients changes the graph. In relation to the first graph where a = 1, the second graph contains a = 2 which causes the actual parabola to narrow or become tighter in appearance. Also the first graph lets b = 0 where as in the second graph b = 3. This b value translates the x-intercepts, where x = 0 and x = 1.5. Finally c = -4 in the second graph which translates the graph along the y-axis.
The next step we will take will be to change the value of x to (x-4). Therefore the function and graph will look like:

and hence graphing the two functions in the same plane gives us:

So how does changing the value of x affect the graph? It becomes easy to see that since we did not change the a, b or c value that the general shape of the parabola does not change. The vertex of the original graph of x is at point (-.75,-5.125) and the vertex of the blue graph that contains (x-4) is at point (3.25,-5.125). Therefore by changing the value of x, this causes a translation in the vertex of the parabola. Now that we have seen that we can make the graph move by changing the a, b, c and x values lets move the vertex of the function
from the fourth quadrant to the second quadrant. Using what we have explored above, we know that changing the a value will not translate the function because it only affects shape. In relation to the c value, when we subtracted 4, the graph moved down the y-axis. Therefore to move the vertex above the x-axis lets add 4 by changing the value of c from -4 to 4.

We have now translated the graph from the fourth quadrant to the first quadrant. Our new goal is to translate the graph from the first quadrant to the second. The b value changes the roots of the equation so even though it translates the graph, changing the value would not serve the purpose of our goal. That leaves us with the value of x. We noticed previously that when we changed x to (x-4), it translated the vertex 4 units to the right. Hence since we want to translate the vertex to the left, lets change the value of x from (x-4) to (x+4). Now our equation and graph become:

Finally lets explore how to flip the graph of the parabola or make it concave down. Using our a, b, c and x values, we know that the c and x value translate the graph on the coordinate plane. The b value changes the roots of the function so therefore the only value that can change the shape of the graph must be the a value. Above, the value is 2 and when we went from a = 1 to a = 2, the graph narrowed. So, using that same logic, if we went from a = 2 to a = .5, the graph would widen as shown below:

Therefore our only option would be to make a = 2 to a = -2.

So we have explored the common forms of parabolas and how changing certain values of the equation can change the shape, the roots and translate the graph around the corrdinate system.