
Christa
Marie Nathe
Sine Language
In
this investigation, we will examine the equation and the graphs where y = a sin(bx + c).
First we will observe the changes when the value of ‘a’ is altered,
while keeping ‘b’ and ‘c’ constant. Similarly, ‘b’ will be varied, while ‘a’
and ‘c’ are not changed. Finally, we will see what happens to the graph when
‘c’ changes, while ‘a’ and ‘b’ remain the constant variables.
Graph Set One:
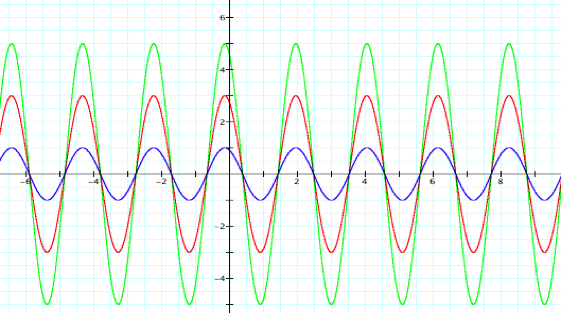
Below are three graphs with various values for ‘a.’ As you can
see, when ‘b’ and ‘c’ are not changed, the height or amplitude of the sine
curve is dependent on the value of ‘a.’
y=1sin(3x+2) y=3sin(3x+2) y=5sin(3x+2)
Graph Set Two:
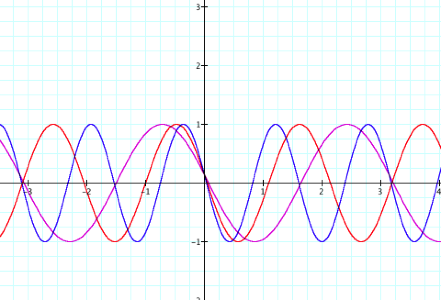
As we can see in the set of graphs where the value of ‘a’ is kept
constant, and ‘b’ is changed the graph looks quite different. The frequency of
the sine graph increases as the value of ‘b’ increases. We can therefore conclude that the
value of ‘b’ directly affects the number of times the sine graph crosses the
x-axis. The higher the value of ‘b’ the more times it crosses the x-axis of a
given interval and the smaller the value, the less frequent it will cross over
a given interval.
y=1sin(2x+3) y=1sin(3x+3) y=1sin(4x+3)
Graph Set Three:
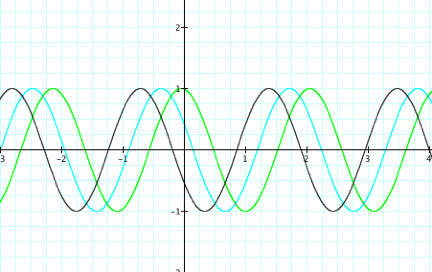
When the values for ‘c’ are changed, the sine curve does not hit
the x-axis more frequently, nor does it change the amplitude of the curve. It
does however, shift the graph to the left, when using positive values. In the
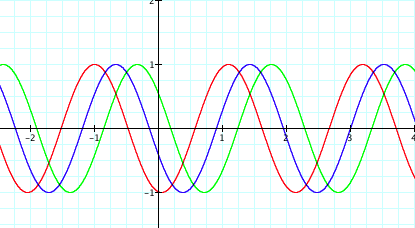
second set of graphs, the values for ‘c’ are negative. Which, as we might have
expected, shifts the graph to the right.
y=1sin(3x+8) y=1sin(3x=9) y=1sin(3x+10)
y=1sin(3x-8) y=1sin(3x-9) y=1sin(3x-10)
As one can observe from the equations and graphs of the various
values of y=asin(bx+c)there can be are many. Depending on desired amplitude,
frequency or left/right shifts the sine equation and graph can reveal specific
qualities.