
Christa
Marie Nathe Parabola Shifts
In
this investigation we are going to construct a series of graphs based on the
equation y=ax2 +
bx + c. There
will be different values for a, b and c which are any rational number. The first set of graphs reflects the
following equations where the value for a is varied, while the others remain constant.
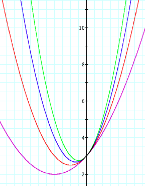
y= 2x2+2x+3
y= 3x2+2x+3
y= 4x2+2x+3
It is obvious from the graph that when the value for a
changes, the
graph is altered. As the value for a increases, the parabola becomes thinner than its
predecessor. If the values for a are negative the parabolas are reflected over the
x-axis.
y= -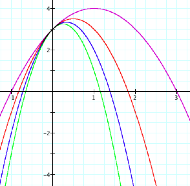 1x2+2x+3
y= -2x2+2x+3
y= -3x2+2x+3
y= -4x2+2x+3
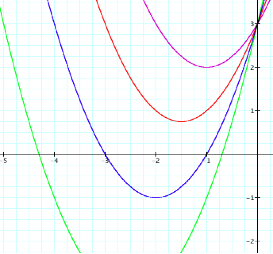
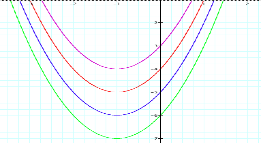
The following graphs reflects the various values of b, while a and c are kept constant. The graph
expands as the value of b increases and interestingly pulls to the left. We can expect that
if the values for b
were negative that the parabola would expand, but pull to the right. As we
observe, this is the case.
y=x2+2x+3 y=x2+2x+3 y=x2+2x+3
y=x2+2x+3 y=x2-2x+3
y=x2-2x+3 y=x2-2x+3 y=x2-2x+3
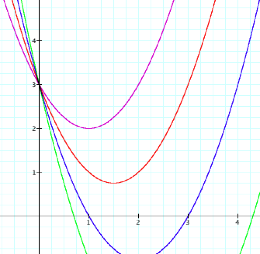
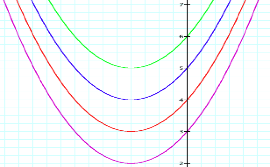
Now we
will look at the graphs of the equation where the value for c is changed, both positive and
negative. As you have observed
from the previous graphs, it would seem that the c value anchors the graph to a y-intercept. As we change c, while a and b remain constant one could
predict the shifts of the graphs.
y=x2+2x-3
y=x2+2x-4 y=x2+2x-5 y=x2+2x-6 y=x2+2x+3 y=x2+2x+4 y=x2+2x+5
y=x2+2x+6
As we
have observed in this investigation, the coefficients a, b
and c have
direct bearing on the graph.
Realizing these implications allows one to understand the functions of
the quadric equation.