
Assignment 1: Lemniscates
Brian Swanagan
Used for various applications, the distance formula appears often and provides for a variety of interesting explorations.
For the distance d between 2 points (x1, y1) and (x2, y2),
d = [(x1-x2)^2 + (y1 - y2)^2]^.5
If we use variables x and y for one set of points, we can analyze chosen distances around particular points.
For example, we can look at the distance to the point (3, 4) from (x, y):
![]() .
.
If we choose a particular distance we are interested in for Distance 1, then we can see what points (x, y) are precisely that far away from (3, 4). Below, we have chosen several distances and you can easily see that they look very much like circles. In fact, the definition of a circle is the set of points that are equidistant from some other point. In other words, they are all the same distance from that point which is exactly what we have done here. We have chosen a distance and a point and found the set of points that are precisely that far away from our particular point.
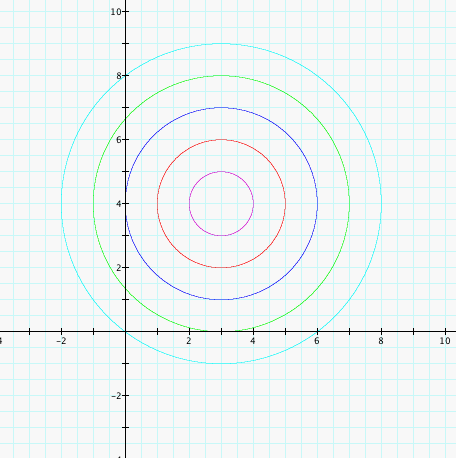
We can see what happens when we choose another point, (-5, -2), and some distances.
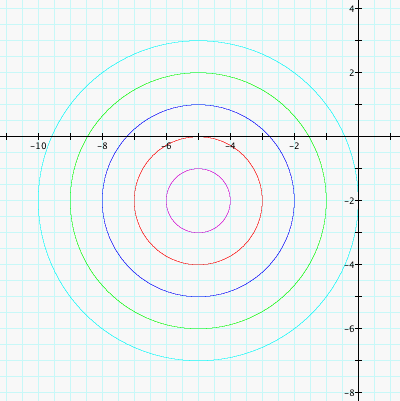
We chose the same distances as before, 1, 2, 3, 4, and 5 from the point (-5, -2) so the graphs look quite similar. You can see, however, that they are located different in relation to the axes. The center of the circles we drew before look to be centered around our point (3, 4) and the circles here appear to be centered around our second point (-5, -2).
Now let's take a look at what happens when we combined the two formulas. If we add the distance equations of the two points and set them equal to some constants, we have a new equation that gives quite a different graph.
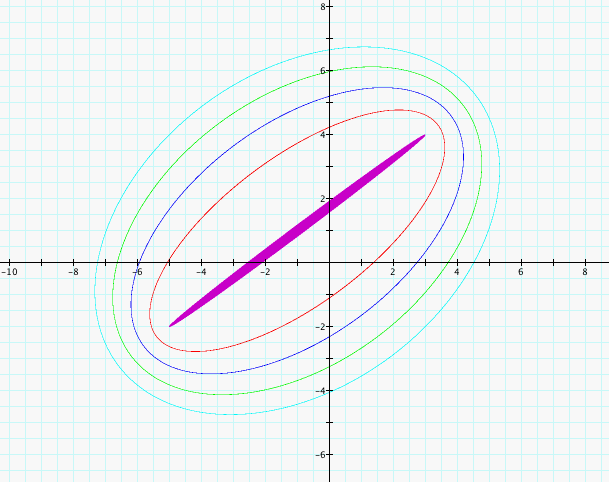
Here, I the costants I used were 10, 11, 12, 13, and 14. We end up with graphs of ellipses which are by definition the set of points that are equal in the sum of their distance from 2 given points which in this case are (3, 4) and (-5, -2).
We can see that the ellipses become a bit more circular as we increase the distance. We might be curious to see what happens for much larger distances.
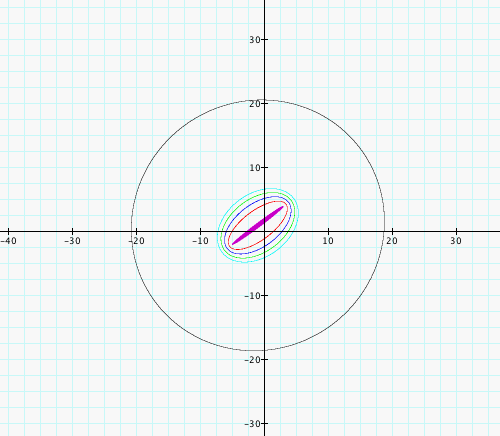
Above, we hve the same constants chosen as before but have added an equation with its constant as 40. We can see that as our distance grows that the two points appear closer together so that as we increase our distance the ellipse approaches a much more circular shape.
Next, let's try multiplying our formulas and setting them equal to a constant. In this way, we receive a much more interesting graph.
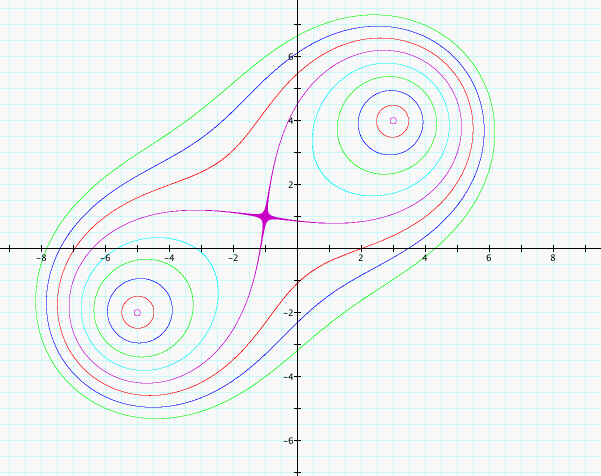
The constants I used were 1 and multiples of 5 up to 40. The inner curves were the smaller constants and the outer curves were the larger ones. The purple one in the center has constant 25.
We can also see that the graph becomes somewhat pillshaped here. We might wonder what happens as our constants become larger still.
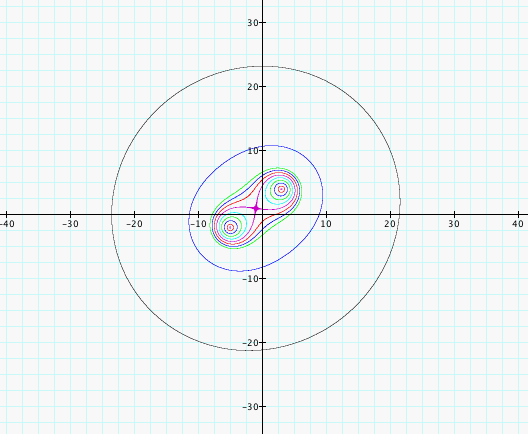
In this picture, I used the constant 100 for the large blue graph and the constant 500 for the outer black graph. We see that for larger constants that our graphs become more elliptical and then start too look more like a circle once again. Even though we take the product of our two expressions here, the 2 center points become relatively closer compared to our constant which is the set of points with the same product of distances from the points. If we took the product of the expressions using the same point twice, we can easily see that we still end up with a circle.
[(x-3)^2 + (y-4)^2]^.5 * [(x-3)^2 + (y -4)^2]^.5 = C which simplifies too (x-3)^2 + (y-4)^2 = C, the equation for a circle with radius C^.5 centered at (3, 4).
So, it is not unexpected that as our C increases for the above equations which cause our points to be closer relative to our C that we would begin to see a more circular shape.
Perhaps the most interesting graph above that we have seen, the lemniscate which is the purple curve that crosses over itself might desire some further investigation.
((x-3)^2 + y^2)^.5 * ((x+3)^2 + y^2)^.5 = 9 gives us a lemniscate along the x-axis.
We can alter this equation into a more useful form.
((x-3)^2 + y^2)^.5 * ((x+3)^2 + y^2)^.5 = 9
((x-3)^2 + y^2)*((x+3)^2 + y^2) = 81
(x-3)^2 * (x+3)^2 + (x-3)^2 * y^2 + (x+3)^2 * y^2 + y^4 = 81
(x^2 - 9)^2 + x^2*y^2 - 6xy^2 + 9y^2 + x^2*y^2 + 6xy^2 + 9y^2 + y^4 = 81
x^4 - 18x^2 + 81 + 2x^2*y^2 + 18y^2 + y^4 = 81
x^4 +2x^2*y^2 + y^4 = 18x^2 - 18y^2
(x^2 + y^2)^2 = 18(x^2 - y^2)
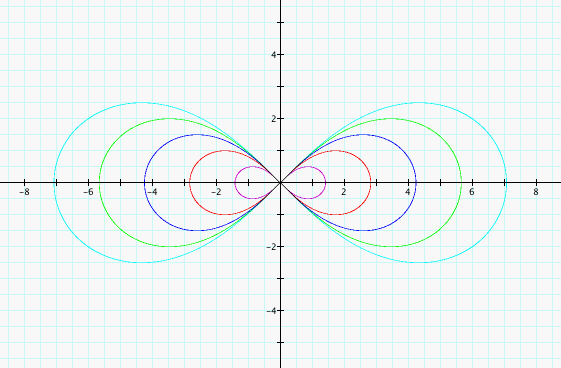
Here, our foci were (-3, 0) and (3, 0). In general if our foci are (-a, 0) and (a, 0), we have the equation (x^2 + y^2)^2 = 2a^2(x^2 - y^2) which isn't hard to derive following the same steps we used above with our starting equation being ((x-a)^2 + y^2)^.5 * ((x+a)^2 + y^2)^.5 = a^2.
Let's see a few graphs for various a values (1, 2, 3, 4, 5 which correspond to the progresssively larger graphs):
In our exploration of these equations, let's add a +b to the right side of the equation and use various values of b to see what happens to the graph.
For b-values 0, 1, 2, 3, 4, 50 and a-value 3, we have the equation (x^2 + y^2)^2 = 18(x^2 - y^2) + b and the following progressively outer graphs:
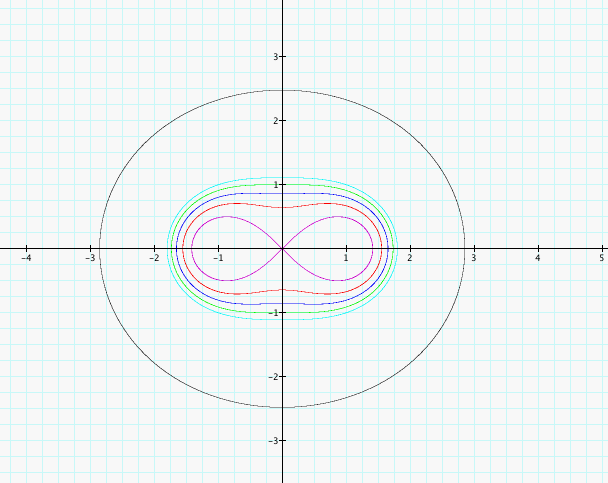
We see that the graph becomes more circular for larger value of b and has an extremely similar effect to what we observed in the original form of the equation as we increased the constant C alone.
Earlier we saw the lemniscates that resulted when our b value was 0 so let's take a look at the graph when a is 0 and b is 1, 2, 3, 4, 5, 6, 7, 8, and 9:
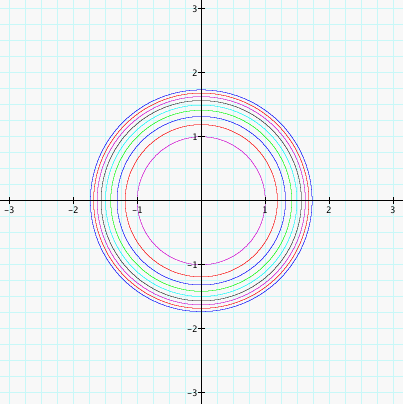
The progressively larger b values corresond to the progressively outer circles. We see that the graph looks quite circular and even though our b value increases steadily that our apparent radii increase at slowed rate. The equation we would have for a=0 is (x^2 + y^2)^2 = b which is indeed gives a circular graph because it can be altered slightly to give x^2 + y^2 = b^.5. The radius for our circles then is b^.25 and x^.25 increases but at a much slower rate for larger x values which correspond to our b value. This explains why we end up with a circle and why the radii appear to increase at a decreasing rate.
Thus far, we changed a when b was 0, b when a was 3, and be when a was 0 so let's see what happens when we have a nonzero b value and change a. Let's choose b to be 50 and a to be 1, 2, 3, 4, 5, 6, 7, and 8 which correspond to the progressively wider graphs below:
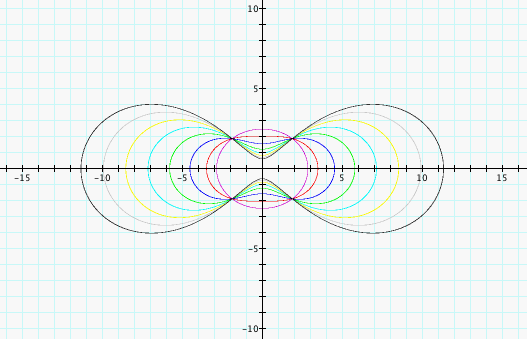
If we choose larger a values, the graph begins to become nor like a lemniscate once more. The foci become farther apart so that our b value which acts much like our C constant from before is not as large with respect to the distance between our points so that the graph becomes less circular and returns more to its lemniscate shape similar to if the b value were decreased.
Anyone well versed in trigonometry might ask if we could simplify the equation by converting it a polar one not only because the equation appears so nice with its x^2 + y^2 and x^2 - y^2 but because it appears to be related highly to circular and elliptical shapes.
When converting to polar, we let x = r*cos(t) and y = r*sin(t) where t is our angular value.
(x^2 + y^2)^2 = 2a^2(x^2 - y^2)
((r*cos(t))^2 + (r*sin(t))^2)^2 = 2a^2((r*cos(t))^2 - (r*sin(t))^2)
(r^2((cos(t))^2 + (sin(t))^2)^2 = 2a^2(r^2((cos(t))^2 - (sin(t))^2)
r^4 = 2a^2r^2cos(2t)
r^2 = 2a^2cos(2t) for r not equal to 0.
Indeed, we have a much more concise equation when we use polar form and it might inform us a bit more about the curve. cos(t) is maximum for t = 0 +2k*pi where k is an integer. At pi+2k*pi and 2k*pi, cos(2t) is maximum which is likely why our curve has maximum length along the x-axis.
We can do much more using sine and cosine curves with our graph. We see that the lemniscate when b=0 crosses the origin in one of our examples but not the earlier one. In the earlier one, the shortest segment between the two points did not cross the origin whereas in our example along the x-axis our points are reflections of each other across the y-axis. Not to mention, the center of the segment was at the origin as well.
If the points are 180 degree rotations of each other and the C value is the square of their distance to the origin, then the origin is a point that fits the equation. For simplicity, let's treat points in polar form and take their angle t on the unit circle and multiply by their magnitude r from the origin. In otherwords, lets use the points (rcos(t), rsin(t)) and (-rcos(t), -rsin(t)). And, let C be the square of either of their magnitude r from the origin.
((x-rcos(t))^2 + (y-rsin(t))^2)^.5((x+rcos(t))^2 + (y+rsin(t))^2)^.5 = r^2
Let's view how it looks when r=1 and for various values of t. We will also graph x^2 + y^2 = 2r^2 but in this case again r=1. The link gives a movie for this demonstration of various values for t.