
Class page
of
Larousse Charlot
Graph Translation
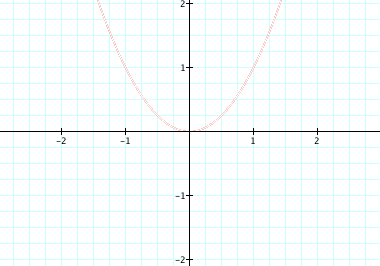
Assuming that you are familiar with parabolas from
trigonometry, the study of angles, I will go ahead and start with the graph of
y = x^2.
Now, we should observe what happens to this
parabola once a constant is added to the equation. For example, y = x^2 + d,
where d is some integer. We then obtain
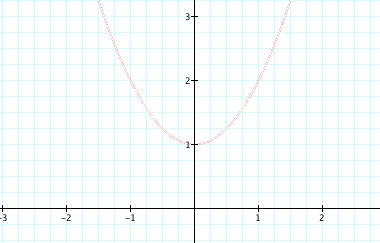
for d = 1
If you observe well, the graph is shifted up one
unit on the y-axis. From this observation, we can conclude that the graph will
shift down if our equation were to be y = x^2 - d for some integer d.
Considering the possibilities, let us see what kind of shiftment that takes
place with y = (x + d) ^2,
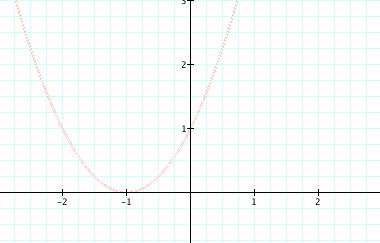
Notice that the graph has shifted to the left, on
the x-axis, given that d = 1. A good question is "why to the left and not
to right, as in the y-axis?" Well, the formula for such shifting is y = (x
- d)^2. From there, the graph would shift to the right of the x-axis. However,
we have y = (x + d)^2 which implies y = (x - (- d))^2. d is a negative integer.
If the equation y = (x - d)^2 - 2
were to present to you, can you infer what would
the graph looks like or how is it shifted if it is a parabola? See the graph
As you can observe, the graph is shifted one on
the x-axis and -2 on the y-axis.
Now, you probably have a sense of what's happening
to the graph, we should observe several graphs simultaneously as the value of
the constant d changes
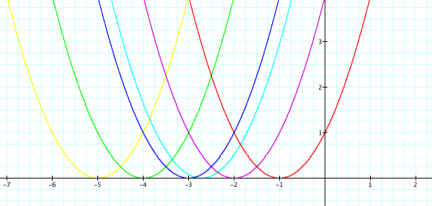
As you can see there, the graph is moved only on
the x-axis and its vertex is remained at -2 on the y-axis. So, as the value of
d changes the graph, the x-cordinate of the vertex changes while the
y-cordinate remains the same
To give a general idea of what's happening here, observe this movement of the graph.