
Class Page
Of
Larousse Charlot
Sine Functions
To best understand the investigation that is about to take
place, we need to have a general knowledge of what sine function is, assuming
that you have a general idea on the basics of mathematics. The sine
function, denoted as sin x, is one of
the basic functions encountered in trigonometry, which is the study of angles and of the angular relationships of
planar and three-dimensional figures. The trigonometry functions are also known
as circular functions. However, we
will focus on sine functions. Let x’ be
an angle measured counterclockwise from the x –axis along an arc of the unit circle. Then sin x’ is the vertical coordinate of the arc endpoint.
Consequently, the sine function is periodic with period 2π since the
circumference of a unit circle is 2 π.
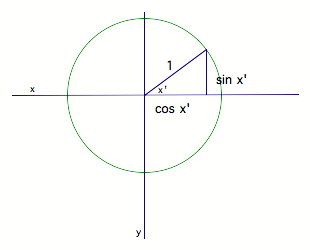
Fig. 1
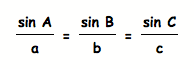
Also, sine function can be seen as ratios of trigonometric functions. It is the ratio of the two sides of a right triangle, through which derive the laws of sine.
If given the triangle ABC with sides a b and c,
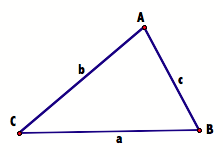
by the definition of sine functions
Now that you have an idea of what the sine function is and how it is obtained, we are going to look at the function y = sin x.
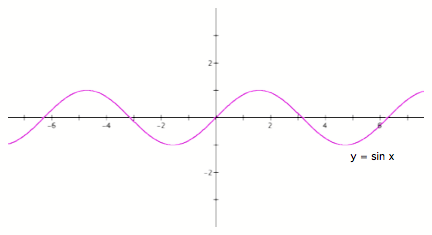
Fig. 2
Observing this graph, you should notice that the function oscillates between -1 and 1.
So, to start our investigation, what do you think happens to the function y = sin x when it is multiplied by a constant k > 1 such that y = k sin x?
See graph.
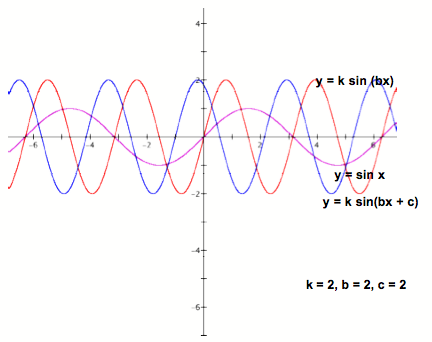
Don’t notice the change? Let us put them on the same graph
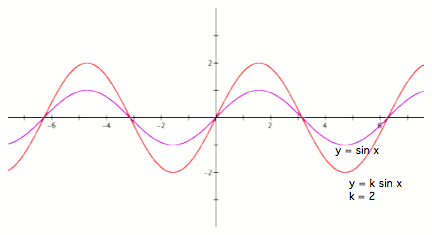
Fig. 3
Notice how the two graphs differ. The function oscillates between -2 and 2. Here, k is referred to as the amplitude of the function. As you can see, k indicates how high the function goes up and down.
Let us take y = k sin x, and multiply x by a constant b such that we have y = k sin (bx), such that b > 1. What happens to the graph then?
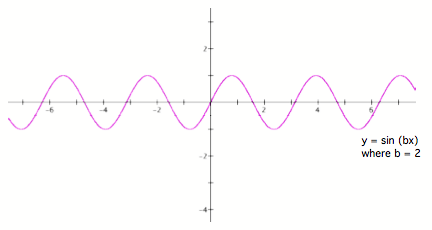
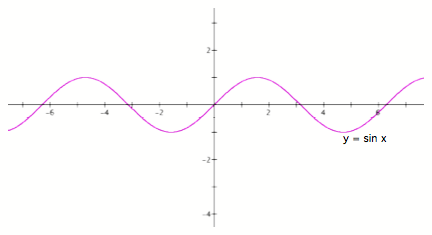
Fig. 4
See the difference?
What you see here is the alternation of the period of the graph. Recall that the function’s period is 2 π; since x is multiplied by b, the period alters to a
faster pace.
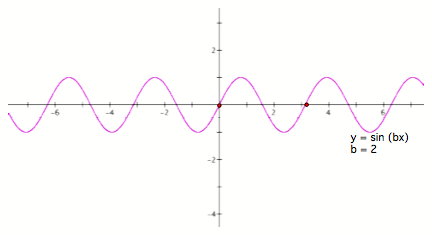
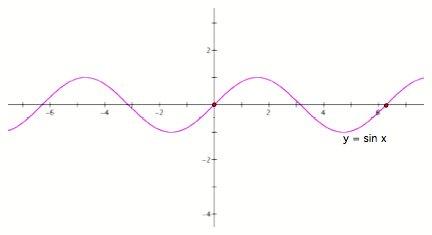
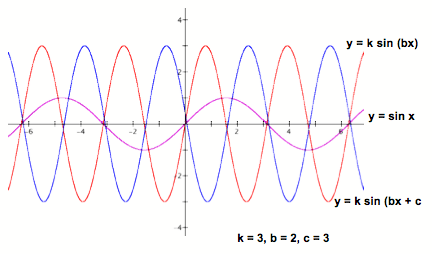
Fig 5
The points on the graphs indicate one period. The period doubles when is multiplied by the constant b = 2.
From observing, we can conclude that the frequency is fastened when it is multiplied by a whole number.
So, we should observe the function y = k sin (bx + c). Now not only the amplitude and the frequency alter, what else?
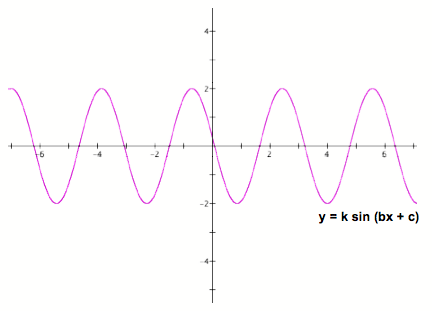
Fig. 6
The difference is as follows:
What we see here is that the graph alters its position when is c is added, for c > 1.
To give us a better view of the changes in the graph, let observe a few of the simultaneously and the values.
As you can see, the constant c shifts the sequence of the function on the x-axis.