

Graphs in the xb Plane
by Molly McKee


Notice that when b=0 the equation becomes x2+c or, in this case, x2+1; the equation is a parabola centered around the y-axis. When b is negative the vertex is located to the right of the y-axis and when b is positive the vertex is to the left of the y-axis. No matter what size the parabola is, it always crosses the y-axis at 1; the point (0,1) is always on the graph of x2+bx+1. If a parabola crosses the x-axis, then it is able to be factored and real roots are able to be found.
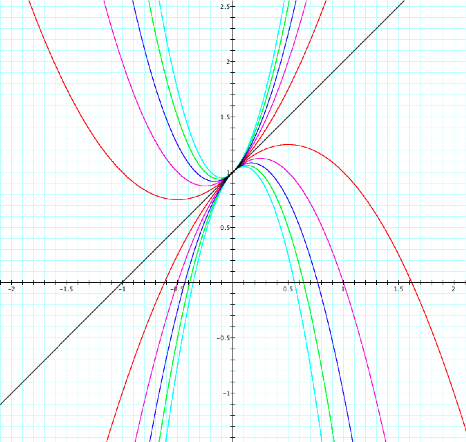
Notice that when a=0 the equation becomes bx+c or, in this case, x+1; the equation is a line. When a is negative the parabola points downwards and the vertex is located to the right of the y-axis. When a is positive the parabola points upwards and the vertex is to the left of the y-axis. No matter what the value of a is the graph intersects the y-axis at 1. As the value of a increases the parabola gets closer the to y-axis (as a increases in the negative direction the parabola also gets closer to the y-axis). No matter what size the parabola is, it always crosses the y-axis at 1; the point (0,1) is always on the graph of ax2+x+1.


For example, x2+2x+1 crosses the x-axis. Therefore it is possible to factor this equation using real numbers: (x+1)(x+1). It is also possible to find the roots of this equation: -1. In this example the parabola only crosses the x-axis at one location, therefore there is only one root. Similarly, x2-2x+1 also crosses the x-axis at only one point. It can be factored as (x-1)(x-1), and it’s root is 1.
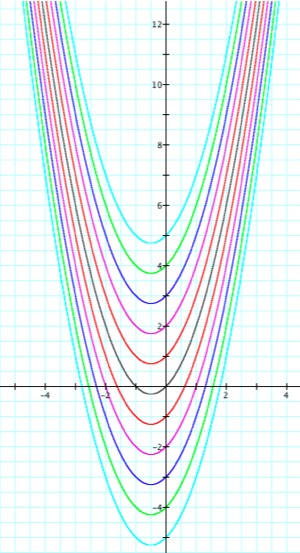

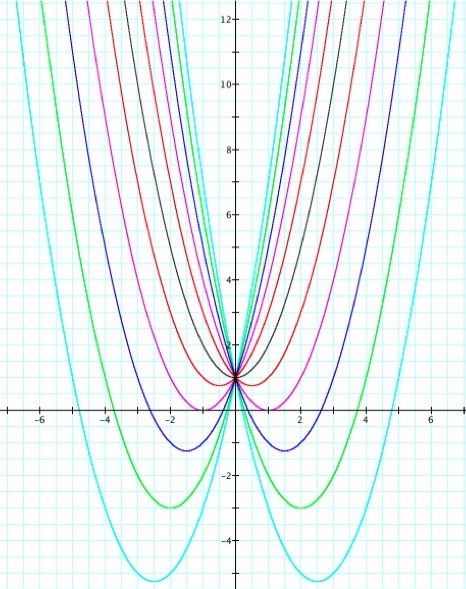
We can see that by changing the value of c, the location of the y-intercept. In this case the vertex is always to the left of the y-axis because a is positive; if a were negative the vertex would be to the right of the y-axis.
A Parabola is locus of points in a plane which are equidistant from a given point and a given line.
Recall the graph where b fluctuated from -5 to 5
a fluctuating between -5 and 5
b = 1
c = 1
a =1
b fluctuating between -5 and 5
c = 1
a = 1
b = 1
c fluctuating between -5 and 5
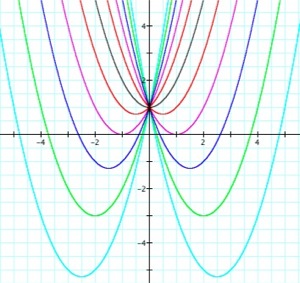
It this case a=1. Notice that the vertices are continuously moving in downward and away from the y-axis. If we mark each vertex of every parabola and then connect them, what will the graph look like?
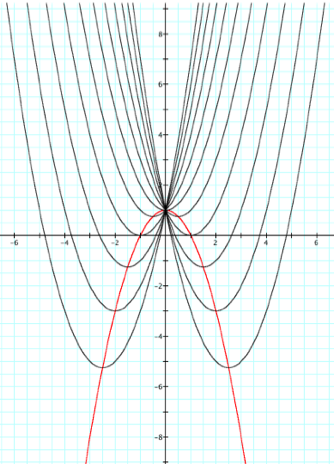
It forms another parabola. First notice that the parabola is turned in the negative direction which implies that the x2 element of the equation is negative. Since the vertex is the y-intercept, we know that when x=0 the c element will be the value of y. The vertex is located at (0,1), so when x=0, y=1. Therefore this parabola is the equation y = -ax2+1.
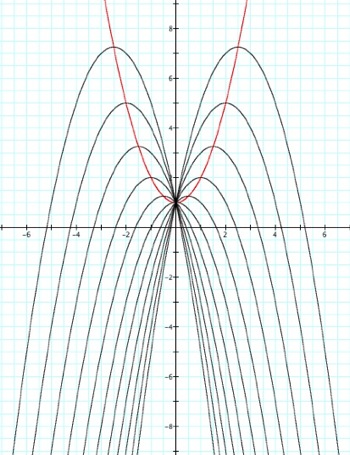
What if a=-1? In this case the vertices are continuously moving in upward and away from the y-axis. By similar reasoning, the x2 element of the equation is positive. Since the vertex is the y-intercept, we know that when x=0 the c element will be the value of y. The vertex is located at (0,1), so when x=0, y=1. Therefore this parabola is the equation y = ax2+1.
Consider the equation
ax2 + bx + c = 0
and investigate several graphs of
y = ax2 + bx + c
with varying a, b, or c as the other two are held constant.