Exploring y=ax2
by Molly McKee

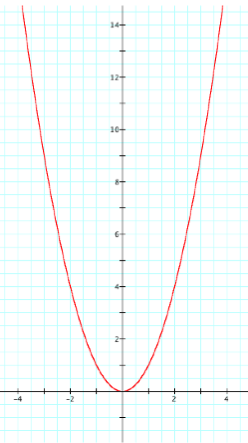
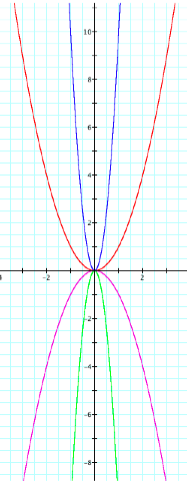
This is the graph of y=ax2 when a=1.
It is important to realize that although a is not a constant number, it is always some number and not a variable. Therefore we can say that a is a scaler of the equation y=x2. Therefore when a=1 the equation yields a parabola. We should expect all equations of the form y=ax2 to result in a parabola, and the only change will be determined by our value for a.
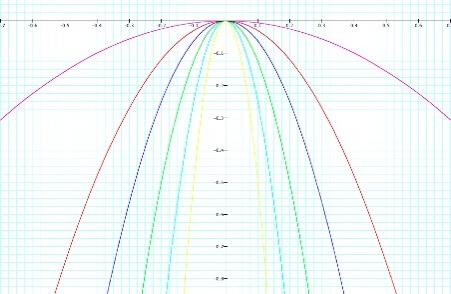
Here we have the graph of y=ax2 with four different values for a.
Notice that when a is a positive number the parabola points upwards, or in a positive direction; when a is a negative number, the parabola points downwards, or in a negative direction.
These examples show the variation when a changes from 1 or - 1 to 10 or -10. We can see that in the case when a=10 or -10 the parabola is much closer to the x-axis; the curve of the parabola is shrinking.


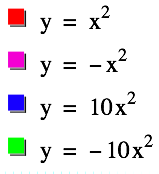
Perhaps now we can hypothesize what happens to the parabola as a gets larger or smaller.
Based on the examples above, it would seem that as a increases in the positive or negative direction, the parabola becomes increasing more narrow.
On the next page we can examine the graph of y=ax2 animated. The animation makes the results of varying a easier to visualize.