
Parametric Curves
by Molly McKee

Other things worth exploring
What happens when a and b are both prime?
What happens when either a or b are not whole numbers?
What happens when a and b are both fractions?
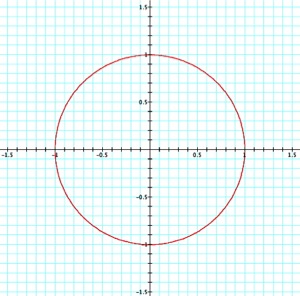
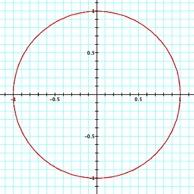
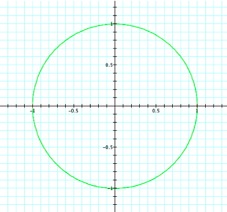
When a=b the parametric equation is a circle centered around the origin.
When a fluctuates the graph expands and contracts along the x-axis. When b fluctuates the graph expands and contracts along the y-axis.
So we have now discovered that a and b are scalers which determine the length or height of the ellipse which is created. It makes sense that when a=b a circle is formed; the distance from the origin is the same along both axes. Therefore the radius of the circle equals a, which also equals b.
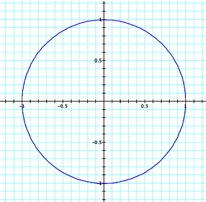
When a=b the parametric equation is still a circle, but notice that no matter what the value of a or b is the radius if the circle is always 1.

Investigate

with varying a and b
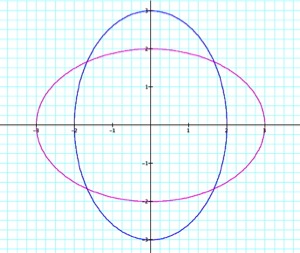
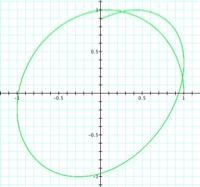
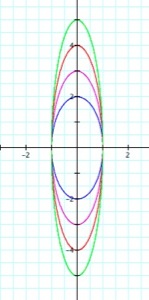
When a and b are different an ellipse is formed, but it is still centered around the origin. Notice that when a=2 the ellipse stretches from -2 to 2 and when a=3 the ellipse stretches from -3 to 3. The same observation can be made about the value of b.
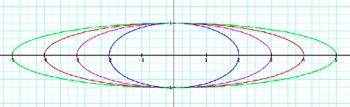
a = 2, a = 3, a = 4, a = 5
b = 1
a = 1
b = 2, b = 3, b = 4, b = 5
Investigate

with varying a and b


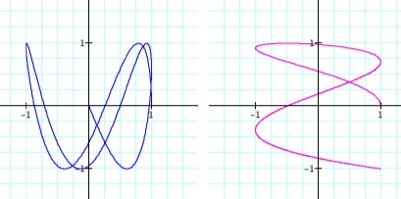
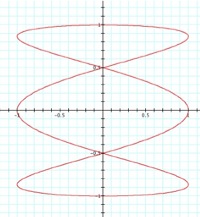
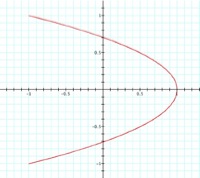
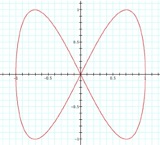
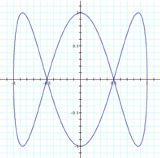
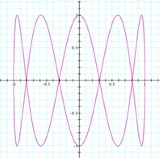
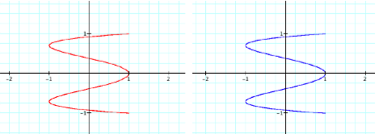
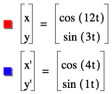
When a is odd and b=1, the graph is continuous and forms ‘loops’. The ‘loops’ are formed along the y-axis and the number of ‘loops’ correspond with the value for a. When a is even and b=1 the graph is not continuous. Notice that when a=2 and a=6 the tails point to the left. When a=4 the tails point to the right. So when a=4k, where k is an integer, the tails point to the right and when a=4k-2, where k is an integer, the tails point to the left. Notice that no matter what the value of a is the graph is contained between -1 and 1.


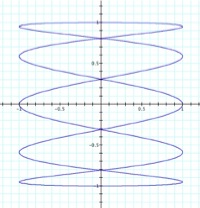


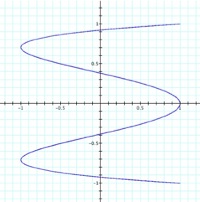
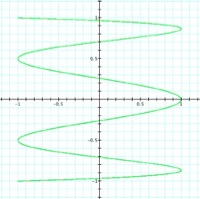

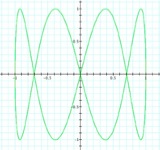
Similarly, when a=1 and b fluctuates the graph is also continuous and forms ‘loops’; the number of ‘loops’ correspond with the value for b. In this case the ‘loops’ are formed along the x-axis and the graph is always continuous as long as b is an integer. Notice that no matter what the value of b is the graph is still contained between -1 and 1.


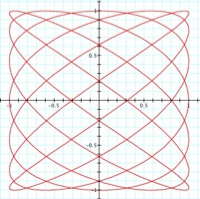
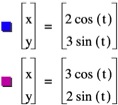
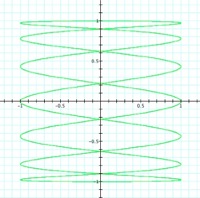
Now let’s explore what happens when a and b do not equal each other and both do not equal 1. Notice that when a=3 and b=12 the graph looks similar to when a=1 and b=4.
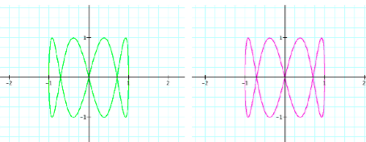

Also notice that when a=12 and b=3 the graph looks similar to when a=4 and b=1.
Hypothesis
If a is greater than b and a = bk, where k is an integer then the graph of

will be identical to the graph of

And if b is greater than a and b = ak, where k is an integer then the graph of

will be identical to the graph of