
Spreadsheets in
Mathematics Explorations
by Molly McKee


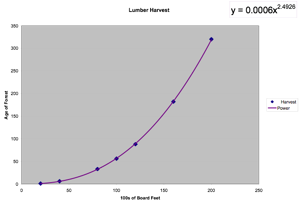
This data is from the lumber industry, giving the approximate number of board feet of lumber per tree in a forest of a given age.

We can use a spreadsheet program to enter the data and generate a scatterplot.


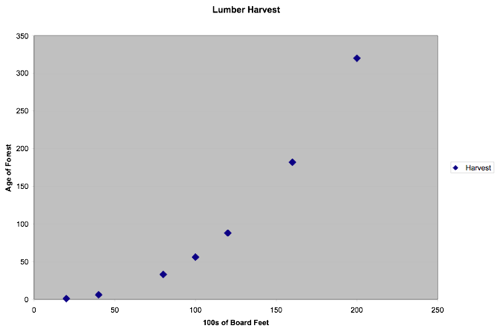
We need to decide which function will give us the best-fitting line.
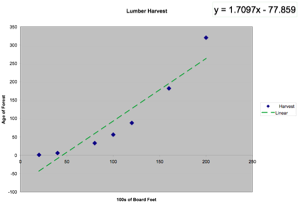
Linear: y=mx+b
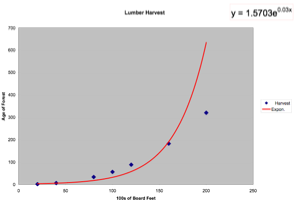
Exponential: y=cebx
Power: y=cxb
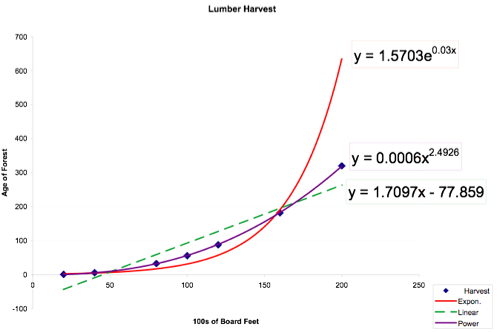
By plotting all three available functions, we can see that the power line provides most accurate trendline.
We can test the accuracy of all three lines by using the functions with data points we already know:
Linear: y=1.7097x-77.859
Exponential: y=1.5703e0.03x
Power: y=0.0006x2.4926
Let x = 80.
The Linear equation yields 58.917.
The Exponential equation yields 17.310
The Power equation yields 33.250.
By the information given, we know that when the forest was 80 years old the lumber harvest was about 33 100s of board feet. The power equation is obviously the most accurate. We can now use this equation to guesstimate how much board feet of lumber can be harvested for a forest of any given age. Let’s assume a forest is 400 years old. Then 400 would be our x-value:
y = .0006(4002.4926)
y = 1836.733
Approximately 1837 100s of board feet could be harvested from a forest that is 400 years old.
Suppose you wanted to see how long you would need to wait to be able to harvest 400 100s of board feet from a forest. In other words, how old would a forest have to be to yield a harvest of approximately 400. In this case we would be solving for x, not y, and 400 would be our y-value:
400 = .0006(x2.4926)
666666.667 = x2.4926
217 = x
So when a forest is approximately 217 years old, the harvest of lumber should be about 400.