

A parametric curve in the plane is a pair of functions x = f(t) and y = g(t) where the two continuous functions define ordered pairs (x,y). These two equations are usually called parametric equations. Usually we think of these equations as x and y "vary with time t" or the angle of rotation that some line makes from an initial location. The extent of the curve will depend on the range of t and close attention should be given to the range of t.
In this exploration, we are going to investigate the parametric equations x = a cos (t) and y = b sin (t) for 0 < t < 2p and different values of a and b. We will observe and describe the characteristics of the curves when a < b, a = b, and a > b. Then we will investigate the parametric equations x = a cos (t) + h sin(t) and y = b sin(t) + h cos (t) for 0 < t < 2p where h is any real number.
First, let's look at the graph of the parametric equations x = a cos (t) and y = b sin (t) for 0 < t < 2p where a and b equal 1.

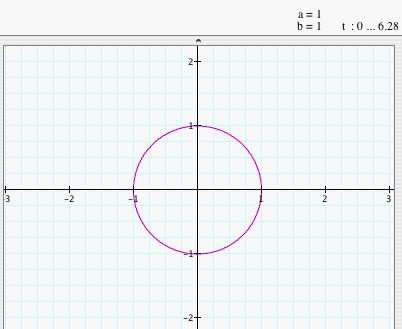
We notice that the graph of the parametric equations x = a cos (t) and y = b sin (t) for 0 < t < 2p is the unit circle. From what we know of the cosine and sine functions, the graphs are periodic (repeat over intervals) and have a range [-1.1]. The period of the functions cosine and sine is 2p, so once t = 2p, the graph will just repeat. So, in the graph above, x and y will range from -1 to 1. To see why the graph is a circle, let's look at the parametric equations:

So, what happens to the graphs when we change a and b with a < b? Let's look at the graphs where a = 1 and b = 2, a = 2 and b = 3, and a = 3 and b = 5.
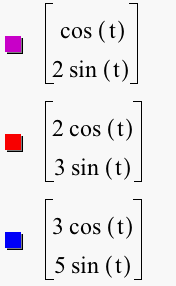
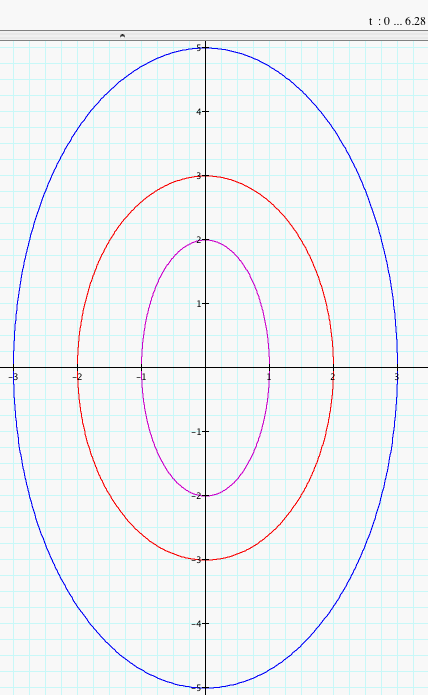
We notice when a < b, the graph of the parametric equations x = a cos (t) and y = b sin (t) for 0 < t < 2p is an ellipse with the major axis on the y-axis and the minor axis on the x-axis. The vertices of the major axis are at b and -b while the vertices of the minor axis are at a and -a. Click HERE to change a and b to negative numbers (with a < b) and observe the graphs. Do they change?
Let's take a look at the graphs of the parametric equations x = a cos (t) and y = b sin (t) for 0 < t < 2p where a = b.
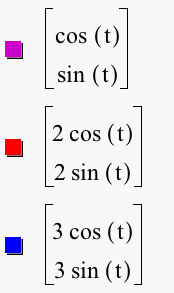
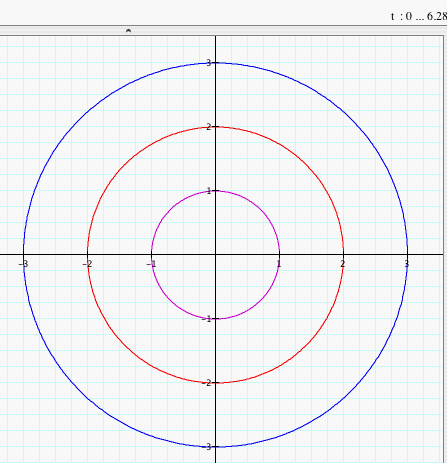
When a = b, the graph of the parametric equations x = a cos (t) and y = b sin (t) for 0 < t < 2p is a circle with radius of a (or b since a = b). Click HERE to change a and b to negative numbers (with a = b) and observe the graphs. Do they change?
Now, what happens to the graph when a > b? Let's look at the graphs when a = 2 and b = 1, a = 3 and b = 2, and a = 5 and b = 3.
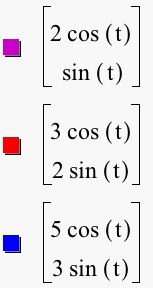
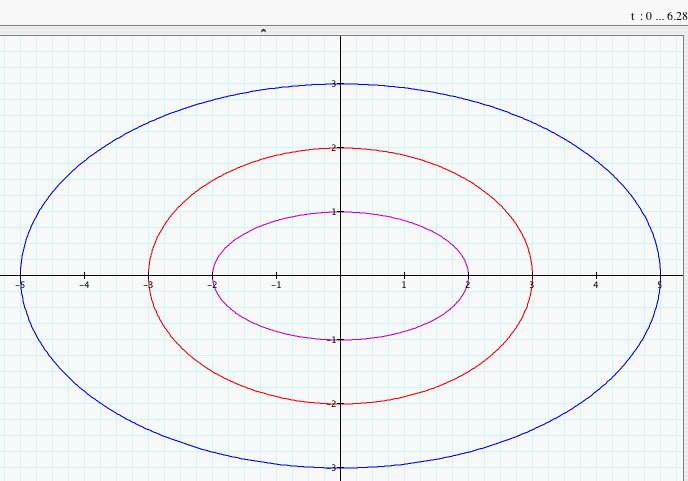
We notice that when a > b, the graph of the parametric equations x = a cos (t) and y = b sin (t) for 0 < t < 2p is an ellipse with the major axis on the x-axis and the minor axis on the y-axis. The vertices of the major axis are a and -a while the vertices on the minor axis are b and -b. Click HERE to change a and b to negative numbers (with a > b) and observe the graphs. Do they change?
Now let's investigate what is changed if the parametric equations are x = a cos (t) + h sin (t) and y = b sin (t) + h cos(t) for 0 < t < 2p where h is any real number. First, we will look at seven graphs where a < b and h = -3, -2, -1, 0, 1, 2, 3.
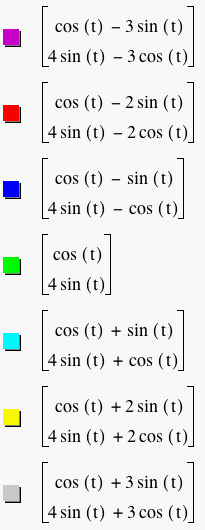
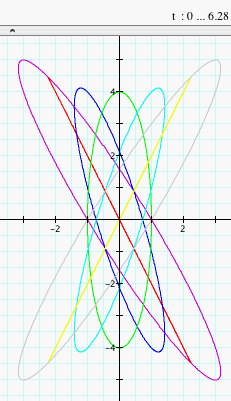
Notice that we have an ellipse since a < b and that when h = 0, the axes of symmetry are the y-axis and x-axis, the major axis is the y-axis, and the minor axis is the x-axis. As h changes, the axes of symmetry change. Also the length of the major axis increases as the absolute value of h increases. Notice that the graphs of x = cos (t) - 2 sin (t) and y = 4 sin (t) - 2 cos(t) for 0 < t < 2p and x = cos (t) + 2 sin (t) and y = 4 sin (t) + 2 cos(t) for 0 < t < 2p are line segments. This is because y is a multiple of x in the form y = mx where m is the slope of the line (in this case, 2 and -2). Click HERE to change a, b, and h (with a < b) and observe the graphs.
Now, we will look at seven graphs where a = b and h = -3, -2, -1, 0, 1, 2, 3.
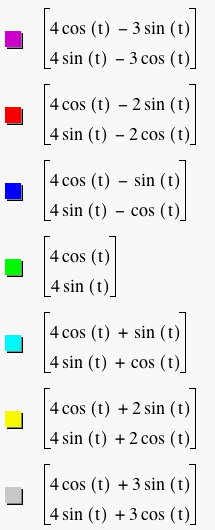
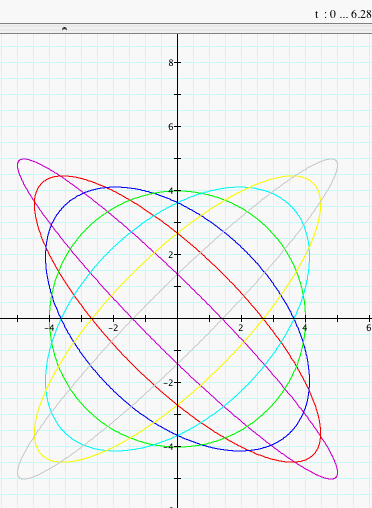
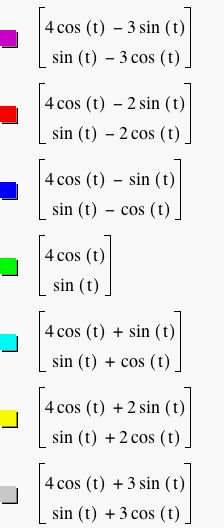
We notice that when a = b and h = 0, we have a circle with radius a (or b) as before. As h changes, the graph becomes an ellipse with axes of symmetry changing and the length of the minor and major axes changing. Only when a = b = h will we get a line segment (since y = x or y = -x). Click HERE to change a, b, and h (with a = b) and observe the graphs.
Finally, we will look at seven graphs where a > b and h = -3, -2, -1, 0, 1, 2, and 3.
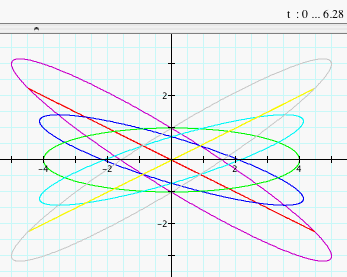
Notice that we have an ellipse since a > b and that when h = 0, the axes of symmetry are the x-axis and y-axis, the major axis is the x-axis, and the minor axis is the y-axis. As h changes, the axes of symmetry change. Also the length of the major axis increases as the absolute value of h increases. Notice that the graphs of x = 4 cos (t) - 2 sin (t) and y = sin (t) - 2 cos(t) for 0 < t < 2p and x = 4 cos (t) + 2 sin (t) and y = sin (t) + 2 cos(t) for 0 < t < 2p are line segments. This is because y is a multiple of x in the form y = mx where m is the slope of the line (in this case, -2 and 2). Click HERE to change a, b, and h (with a > b) and observe the graphs.