
In this investigation, we are going to examine
the graphs of ![]() when b is changed
while a and c are held constant. Then we are going
to further examine the vertices of the set of parabolas with different
b's and show that the graph of these vertices, called the
locus, is also a parabola with an equation that has some interesting
characteristics.
when b is changed
while a and c are held constant. Then we are going
to further examine the vertices of the set of parabolas with different
b's and show that the graph of these vertices, called the
locus, is also a parabola with an equation that has some interesting
characteristics.
First we will look at the graph of the parent
equation ![]() . This is the case
where a = 1, b = 0, and c = 0.
. This is the case
where a = 1, b = 0, and c = 0.
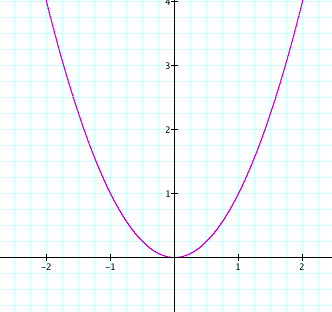
What observations of the graph do we notice?
First, the vertex of the graph lies on the y-axis. The graph opens
upward since a is positive. The vertex also lies on the
x-axis since c = 0. So what happens when we fix a
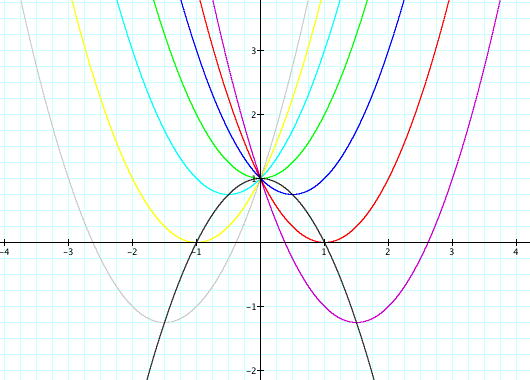
and c and change b? Let's look at the graphs of
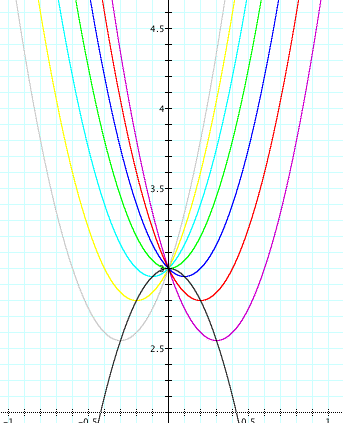
![]() when a = 1, c =
1, and b = -3, -2, -1, 0, 1, 2, and 3.
when a = 1, c =
1, and b = -3, -2, -1, 0, 1, 2, and 3.
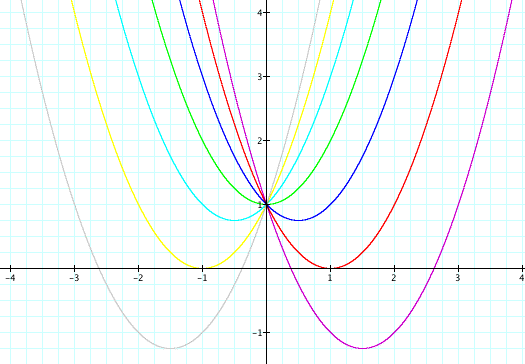
As we can see from this set of parabolas, the vertex is displaced from the y-axis as b is changed. When b = 0 (orange), the vertex is on the y-axis. When b > 0, the vertex is to the left of the y-axis and when b < 0, the vertex is to the right of the y-axis. All of the parabolas pass through the same point (in this case it's (0,1) since c = 1). We also notice that when b < -2, the parabola intersects the x-axis at two points with positive x values. This means that the equation has to real roots, both positive. When b = -2, the parabola is tangent to the x-axis (intersects at one point with positive x value) which means that the equation will have one real root that is positive. When -2 < b < 2, the parabola does not intersect the x-axis and therefore, the equation has no real roots (it does have complex roots). When b = 2, the parabola is tangent to the x-axis (intersects at one point with negative x value) which means that the equation will have one real root this is negative. When b > 2, the parabola intersects the x-axis at two points with negative x values. This means that the equation has two real roots, both negative.
Now that we see how changing b affects
the graph of ![]() , let's focus our
attention to the vertices of the parabolas. It seems that if we
graphed just the vertices, we would get another parabola. We call
this the locus of the vertices. But what would the equation of
the locus be? Let's see if we can come up with one. We know that
the vertex of the locus will be at (0,1) because one of our original
parabolas has a vertex there. Since the vertex is on the y-axis,
the equation of the locus must have b = 0. Also, since
the vertex is at (0,1), the equation of the locus must have c
= 1. Since the parabola opens downward, we know that a
< 0. Using another point on the locus, say (1,0), we can solve
for a and get a = -1. So, the equation for the locus of
the vertices is
, let's focus our
attention to the vertices of the parabolas. It seems that if we
graphed just the vertices, we would get another parabola. We call
this the locus of the vertices. But what would the equation of
the locus be? Let's see if we can come up with one. We know that
the vertex of the locus will be at (0,1) because one of our original
parabolas has a vertex there. Since the vertex is on the y-axis,
the equation of the locus must have b = 0. Also, since
the vertex is at (0,1), the equation of the locus must have c
= 1. Since the parabola opens downward, we know that a
< 0. Using another point on the locus, say (1,0), we can solve
for a and get a = -1. So, the equation for the locus of
the vertices is ![]() . Let's graph this
along with the above graph and see what it looks like.
. Let's graph this
along with the above graph and see what it looks like.
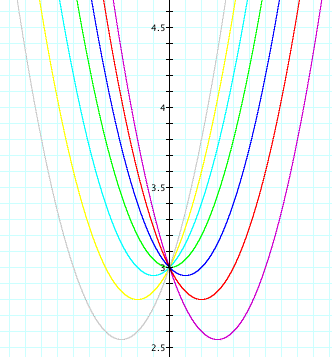
We see that the locus does indeed pass through
each of the vertices of the original set of parabolas. What observations
can be made about the equation of the locus and the equations
of the original set of parabolas? First, we see that the equation
of the locus has the same c value. Second, we see that
the equation of the locus has the opposite a value. And
last, we see that the equation of the locus has a b value
of 0. Will this always work? Let's check out the graphs of ![]() where a = 5, c =
3, and b = -3, -2, -1, 0, 1, 2, and 3.
where a = 5, c =
3, and b = -3, -2, -1, 0, 1, 2, and 3.
From our previous observations about the equation
of the locus of these vertices, let's guess that the equation
of the locus is ![]() . Are we correct?
Let's see.
. Are we correct?
Let's see.
Looks like we're correct! Now we can generalize
the equation of the locus for a set of parabolas where a
and c are fixed and b changes. The equation of the
locus will have -a, b = 0, and c. So, for
a set of parabolas with equations ![]() ,
a and c fixed and b variable, the equation
of the locus will be
,
a and c fixed and b variable, the equation
of the locus will be ![]() .
.