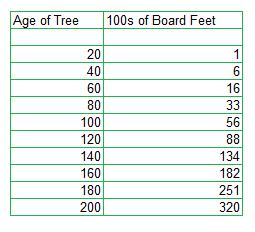

We want to explore the use of Excel spreadsheets to work through mathematics problems. In this particular problem, we will explore the amount of board feet based on the age of a tree. We want to find the model that best fits the given data. As well, we want to complete the data; that is, find the missing numbers of board feet for certain ages. Here is the given data,
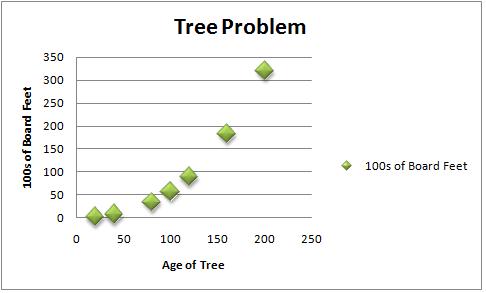
Let us first take a look at the scatter plot created by the given data.
Now we need to find models that will best fit this data set. We will look at an exponential model first. We will construct the trendline following an exponential model, as well as show the r-value.
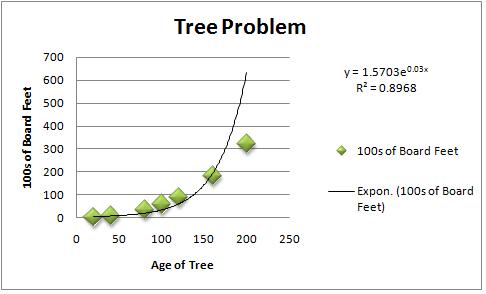
We can see that the exponential model is not the best fit (hopefully). We can also see this from the r-value, which happens to be 0.8968. So maybe there is a better fitting model. We will try the polynomial trendline.
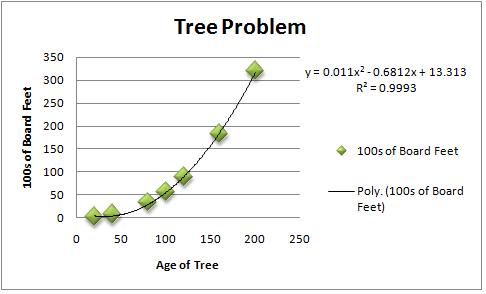
This polynomial model (degree 2) fits the data better than the exponential model. We can see the r-value is 0.9993, so this model is defnitely a better fit. Maybe there is another model that fits the given tree data the best. Lastly, we will try the power model.
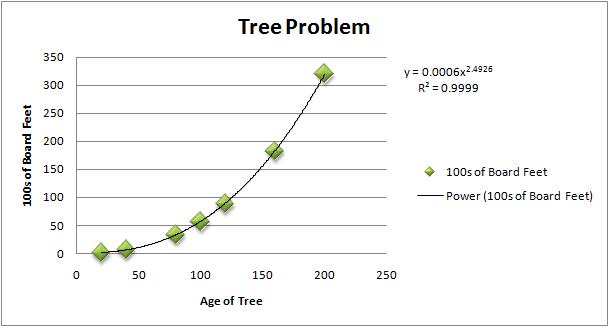
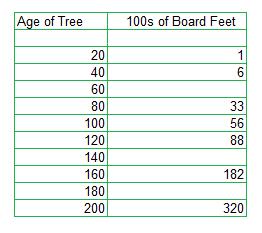
We can see quite well that the power model is the best fit for this data set. The trendline follows the path of the data and the r-value is 0.9999. We will now use this function model to evalute at the missing values (60, 140, and 180). The following is the completed chart, filling in the blanks,