
Graphs of y = (x - d)2 - 2 as d varies from -3 to 3
by Michael Walliser

Graphs of y = (x - d)2 - 2 as d varies from -3 to 3
by Michael Walliser
For this assignment, we will examine the graphs of y = (x - d)2 - 2 as d spans integers from -3 to 3.
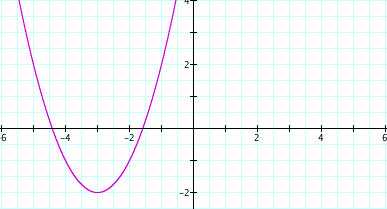
d = -3
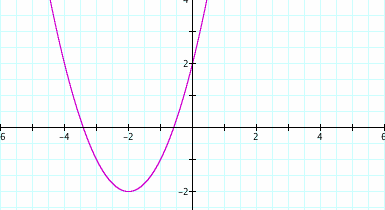
d = -2
d = -1
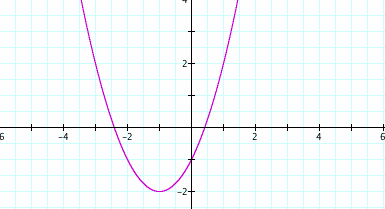
Notice how the parabola moves from left to right as d increases, but its shape and vertical position remain the same.
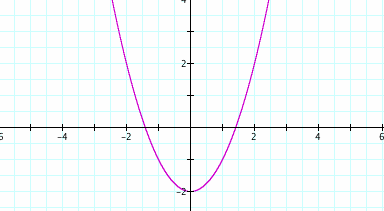
d = 0
d = 1
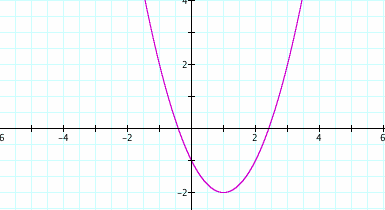
d = 2
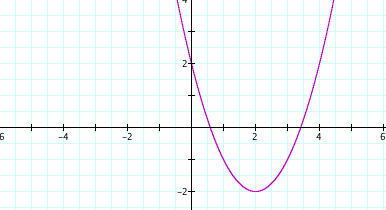
d = 3
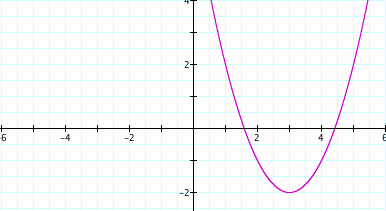
If we look closer, we see that the vertex of each parabola is located at the point x = d, y = -2. Examining all 7 graphs, we note that from each vertex, if we go one unit to the right and one unit up, we find another point on the parabola. Also, if we go one unit to the left and one unit up from the vertex, we find another point. Using the vertex and these two points to define the shape of the parabola, we can see that even as d changes, the shape of the parabola stays the same. We also note that the vertical position of the graph does not vary with d, as each vertex is located at y = -2.
We conclude that as d varies, the graph of y = (x - d)2 - 2 maintains the same shape and vertical position, but shifts left and right so that the vertex of the parabola is located at x = d.