Charlie Conway 7/27/2009
Polar Equations
For this exploration, we will investigate equations of the type
![]()
When a and b are equal and k is an integer, then this formula is commonly known as the "n-leaf rose." This is a fairly obvious name, as you will see when we investigate the graph.
When a and b and k are all 1, then the graph looks like a single leaf with x-intercepts of 0 and 2 and y-intercepts of 1, 0, and -1.
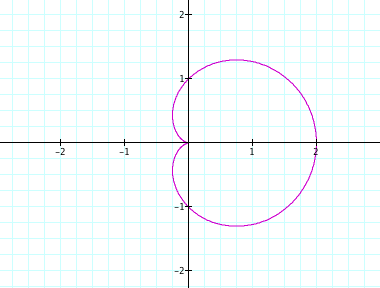
If we change the values of a and b, still making them equal, and leaving the value of k=1, the shape of the graph is the same, only bigger. The y-intercepts move to the positive and negative of the values of a and b. Also, part of the graph always comes to a point at the origin. The other x-intercept increases to cross the x-axis at the sum of a and b. If the values of a and b are negative, the graph is simply reflected across the y-axis.
What if a and b are different, still leaving k=1? Perhaps the simplest form of this graph would be when a=1 and b=2, so our equation would be
![]()
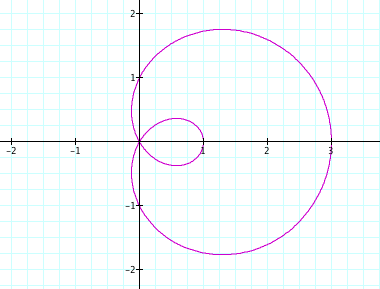
As you can see, the y-intercepts are 0, 1, and -1, reflecting the positive and negative value of a and the crossing at the origin. The x-intercepts other than the origin are 1 and 3, which interestingly correspond to b+a and b-a. Perhaps a better way to think about this fact is with respect to the distance from the origin along the x-axis of each loop. The big loop extends 3 units or b+a units, and the smaller loop extends b-a=1 unit.
This relationship also holds when a is larger than b. In the case where a=3 and b=2, the graph looks like this
![]()
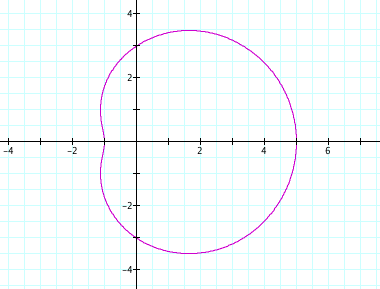
Again, the graph has y-intercepts of -3 and 3, which correlate the positive and negative values of a. The x-intercepts are 5 and -1, which correlate to b+a and b-a.
Now that we have investigated many of the properties of our equation with k=1, let's change the value of k. As we said earlier, when a and b are equal and k is an integer, then the graph is known as an "n-leaf rose."
![]()
for k ranging from 0 to 10 to 0
As its name suggests, the graph "grows" a new leaf at every integer k.
The graph as k changes while a=b is interesting but fairly simple. The graph as k changes with a and b not equal is a bit more complex but not something that is necessarily shocking. Here are two examples of equations with a not equal to b, with different values for k.
![]()
![]()
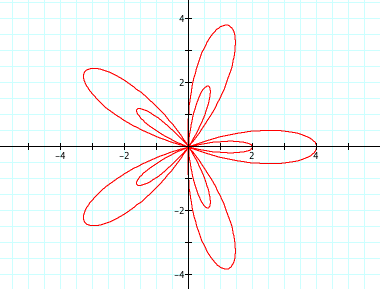
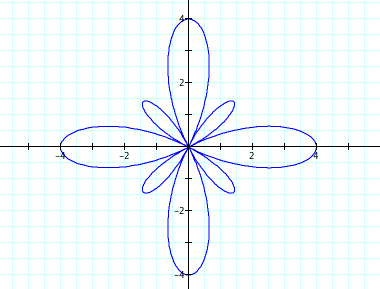
In the first graph, in which k=5 (an odd integer), there are 5x2=10 pedals, five larger pedals and five smaller pedals. Each of the smaller pedals is centered inside one of the larger pedals. The bisectors of two pedals is on the x-axis, with one reaching its maximum x-value at 4 and the smaller one reaching its maximum x-value at 2. This is consistent with what we have discovered thus far in that the bigger "loop" corresponds to b+a and the smaller loop corresponds to b-a. These distances are the same for all of the pedals, not just the pedals on the x-axis. The graphs of all the equations with odd values of k have similar properties, with the smaller pedals being inside of the larger pedals and one pedal being centered on the positive x-axis.
In the second graph, we have k=4, an even integer, and there are as you might expect, 4x2=8 pedals. The difference, as you can see, is that with even values of k, the smaller pedals are centered in between the larger pedals. However, the length of the pedals still correspond to the values of a+b and a-b.