Assignment 12: Investigating Fibonacci
By Krista Floer
Generate a Fibonacci sequence in the first column using f(0) = 1, f(1) = 1,
f(n) = f(n-1) + f(n-2).
a. Construct the ratio of each pair of adjacent terms in the Fibonacci sequence. What happens as n increases? What about the ratio of every second term? etc.
b. Explore sequences where f(0) and f(1) are some arbitrary integers other than 1. If f(0)=1 and f(1) = 3, then your sequence is a Lucas Sequence. All such sequences, however, have the same limit of the ratio of successive terms.
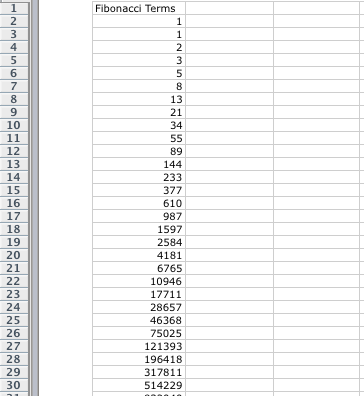
First I constructed the Fibonacci sequence in the first column. The Fibonacci sequence is formed by adding the previous two terms together to get the next term.
To have Excel do it for you, in the first two rows you put your initial values. Our initial values are 1 and 1. In the third row, instead of typing a number, you type in a formula. The first cell is A2 and the second cell is A3. In A4 where you want to have the rest of your sequence begin, type "=A2+A3". This will tell the program what you want it to do. A black box will appear around the cell. Click on the bottom right corner to drag it down to the rest of the rows. This will give you the first column seen below on the left.
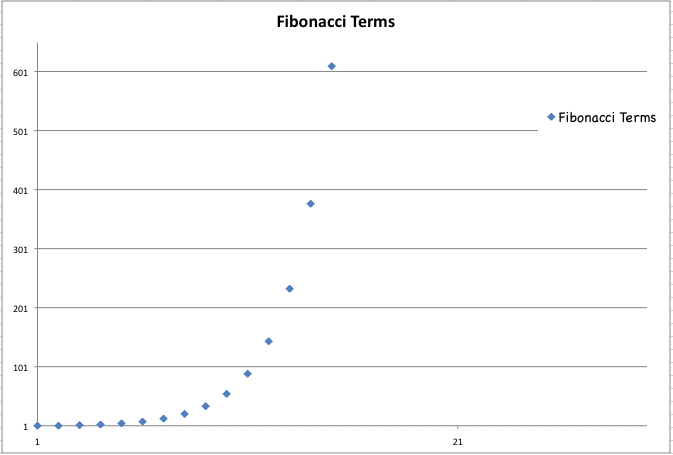
I think it is interesting to note that the Fibonacci sequence forms the shape of an exponential function. We do not connect the points on the graph because not every x value is used. The Fibonacci sequence only uses specific positive integers.
| The Fibonacci Sequence is List Form | The Fibonacci Sequence is Graph Form |
|---|---|
|
|
a. The ratio is formed by dividing two consecutive terms in the Fibonacci sequence, with the most recent term being the numerator. To get Excel to do this for you, start in column B. You want the sequence to start in B3. The formula to type is "=A3/A2". Again, drag the bottom right corner of the black box as far down as you want, and Excel will fill in the values for you.
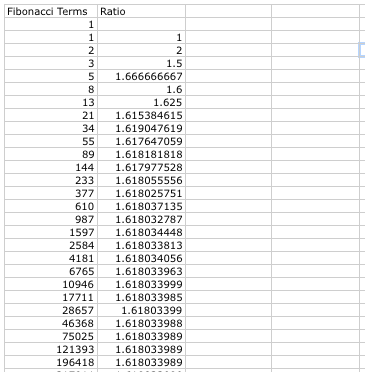
We can see that the sequence oscillates to the convergence value. Near the bottom of the picture, the ratio seems to be the same each time, but they really aren't. The values in each cell were too long so the program rounded the numbers. So really the ratios are different but they are very close. As n gets larger, the ratio gets closer to the convergence value.
Next I constructed the ratio of every second term, seen here:
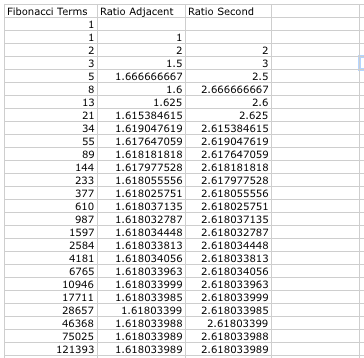
Again, we can see that the ratio oscillates, but eventually it gets closer and closer to a single value.
Then I constructed the ratio of every third term, seen below.
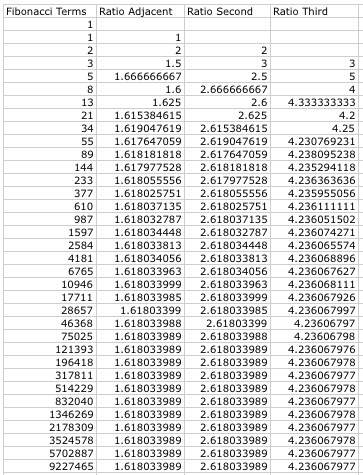
We see the same thing again, the ratio oscillates as it converges. I thought it would be useful to look at the ratios of a graph:
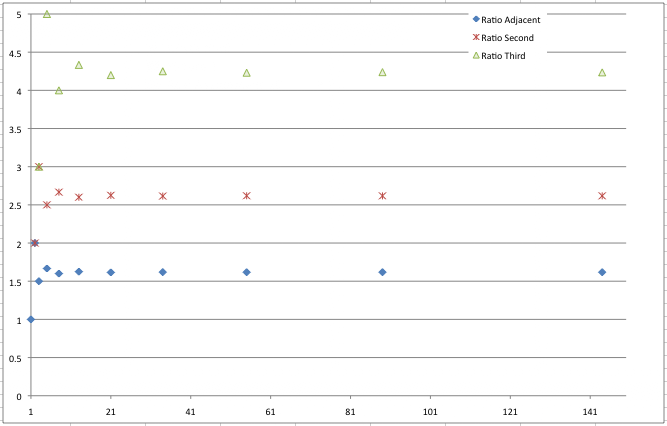
In the graph above, it is easier to see that the ratio oscillates, but eventually moves so little that it looks like it becomes constant.
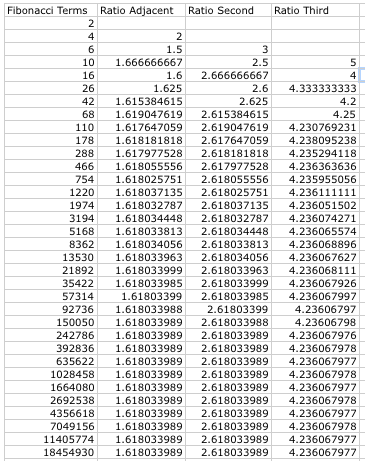
b. Now let us look at sequences that are formed the same way as Fibonacci, but the initial values are different.
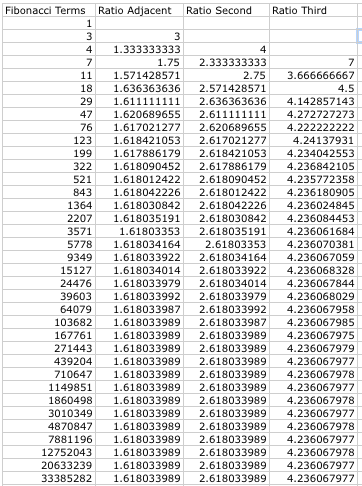
| f(0) = 2, f(1) = 4 | f(0) = 1, f(1) = 3 Known as the Lucas Sequence |
f(0) = 0, f(1) = -3 |
|---|---|---|
 |
 |
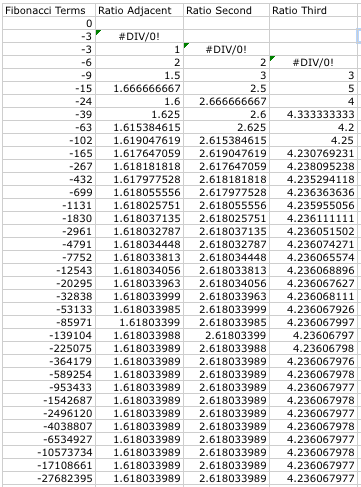 |
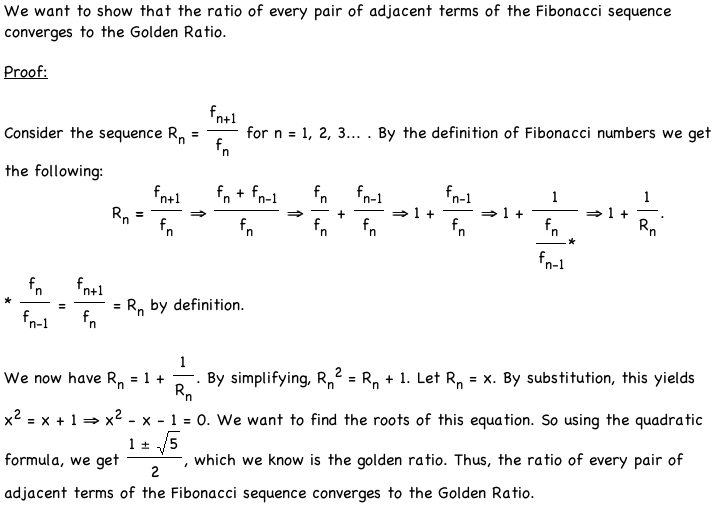
Not many surprising things happened when we changed the initial values, unless you look at the convergence values. The chart on the right has "#DIV/0!" in some cells. This is just Excel telling us we can't divide by 0! For the ratio of every adjacent pair, it converged to the same value regardless of the initial values. This number also looks familiar. It is the famous GOLDEN RATIO! This would lead us to a proof:
Now that we have shown that the ratio of every adjacent pair of terms of the Fibonacci sequence converges to the Golden Ratio, we need to prove something about the ratio of every second term.
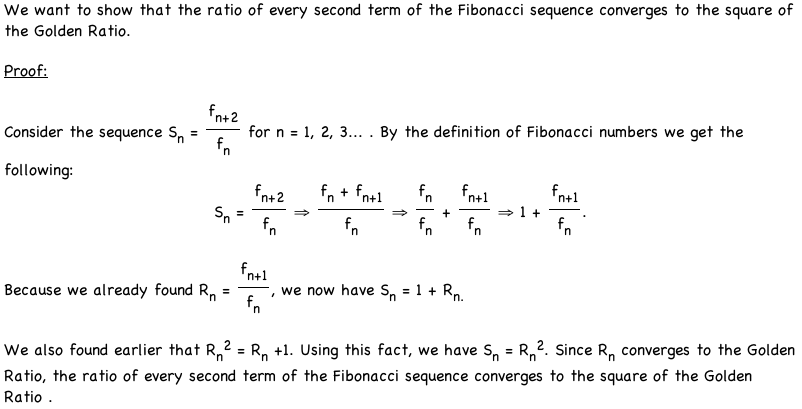
We now also have that the ratio of every second term converges to the square of the Golden Ratio. What about the ratio of every third term?
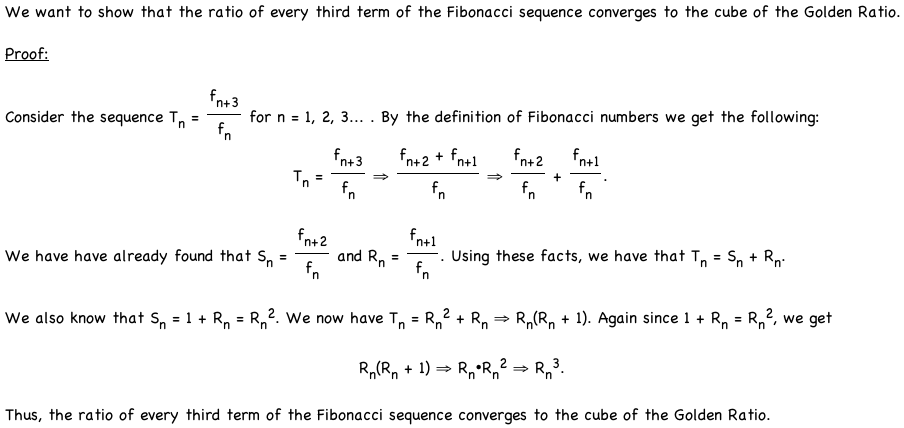
From this proof, we see a pattern emerging. The ratio of the kth term of the Fibonacci sequence will converge to the Golden Ratio raised to the kth power. Another way to write this is:
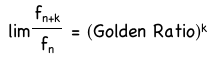
This can be proven using the same methods as in the proofs above. This is left for your entertainment.