
Assignment II: Parabola & Quadratic Functions
by
Rui Kang
Examine graphs for the parabola:
![]()
for different values of a, b, and c. (a, b, c can be any rational numbers)
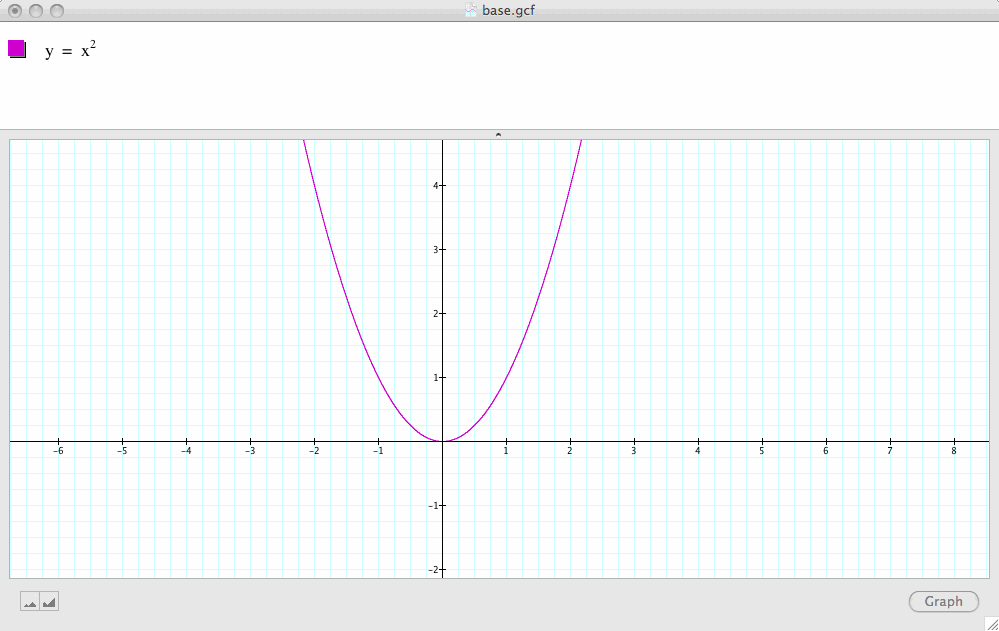
First, let's look at our base case
![]()
Note in this case, a=1, b=c=0
The next three graphs demonstrate what happens if we fix b and c to zero and vary a:
First, let a=2 and a=3 and compare the graphs ![]() and
and ![]() with our base case:
with our base case:
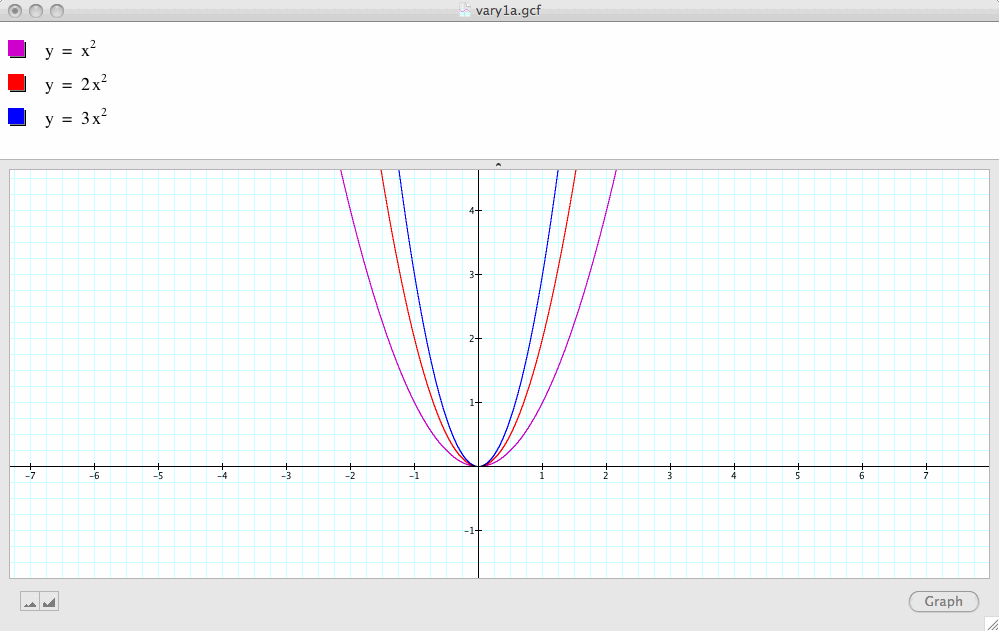
It seems that increasing the value of a when a is greater than 1 narrows the graph.
Second, let a=1/2 and a=1/5 and compare these graphs with our base case:
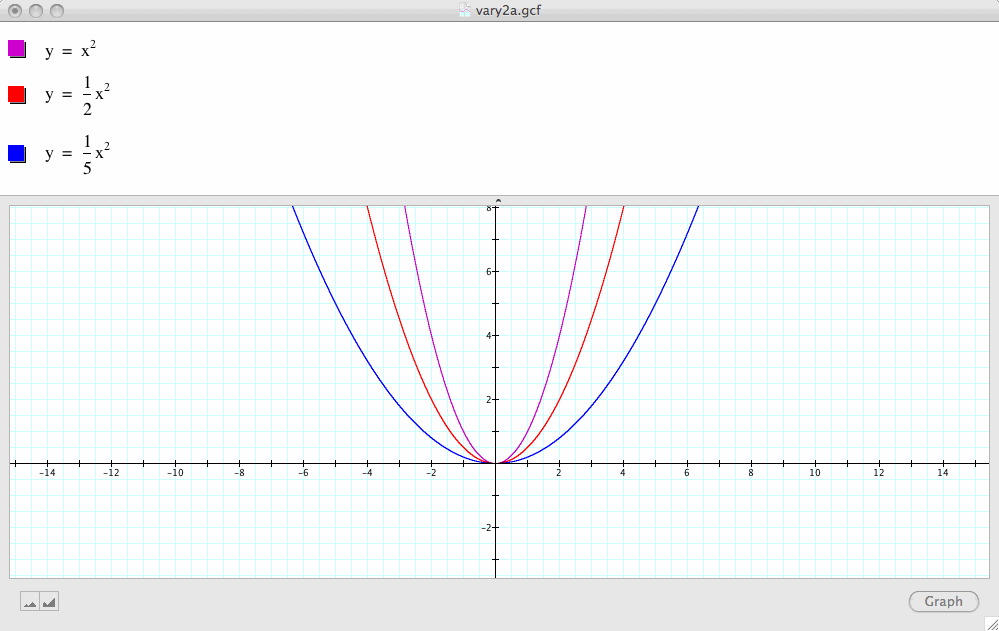
It seems that decreasing the value of a when a is less than 1 but greater than zero widens the graph.
Finally, let a=-1, a=-1/2 and a=-5 and compare these graphs with our base case:
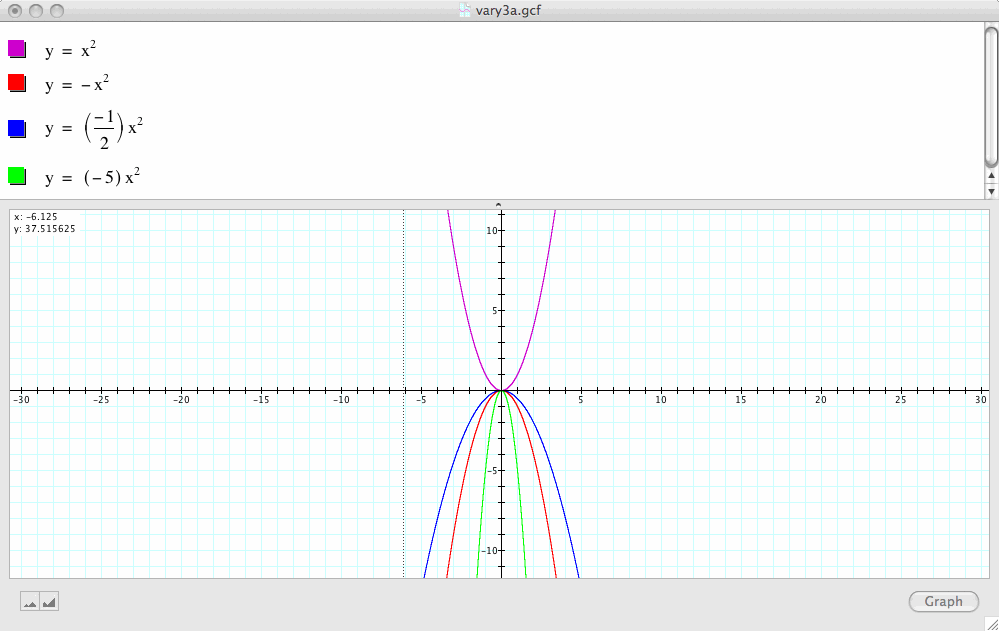
It seems that negative values of a behave pretty much like the positive values of a except that the graphs now are reflected across the x-axis as compared to the base case.
Conclusion 1: In general, the sign of a determines the direction to which the parabola opens up. If a is positive, the parabola opens up.
If a is negative, te parabola opens down.
|a| determines the width of the parabola. As |a| gets larger, the graph becomes narrower; as |a| gets smaller, the graph becomes wider.
The next three graphs demonstrate what happens if we fix a=1, c=0 and vary b:
First, let's graph
![]()
(where b equals any arbitrary value n).
We let n vary from -10 to 10 and observe what happens.
(Click on the Play button to start the movie if the movie is not already playing)
It seems that the vertex travels along another parabola which is the reflection of ![]() across the x-axis.
across the x-axis.
In other words, if we have ![]() , n belongs to [-10, 10], the vertex of this family of parabola travels along the path of the parabola
, n belongs to [-10, 10], the vertex of this family of parabola travels along the path of the parabola
![]() which happens to be the reflection of
which happens to be the reflection of ![]() with respect to the x-axis.
with respect to the x-axis.
Second, let's observe the position of the vertex of the parabola: ![]() (b equals any arbitrary value n). We let n>0 and vary from 0 to 10 this time:
(b equals any arbitrary value n). We let n>0 and vary from 0 to 10 this time:
(Click on the Play button to start the movie if the movie is not already playing)
Note that the vertex of the parabola under this case is always to the left of the vertex of our base case, i.e., [0,0]
Finally, let's observe the position of the vertex of the parabola: ![]() (b equals any arbitrary value n).
(b equals any arbitrary value n).
We let n<0 and vary from -10 to 0 this time:
(Click on the Play button to show the movie if the movie is not already playing)
Note that the vertex of the parabola under this case is always to the right of the vertex of our base case, i.e. [0,0]
Conclusion 2: In general, as b varies, the vertex travels along another parabola, which happens to be the reflection of![]() .
.
In other words, as b varies, the locus of the vertices of the set of parabolas is another parabola.
If b>0, the vertex travels to the left of the y-axis; if b<0, the vertex travels to the right of the y-axis.
The next graph demonstrates what happens if we fix a=1 and b=0 and change c:
Let's observe what happens if c=3 and c=-4
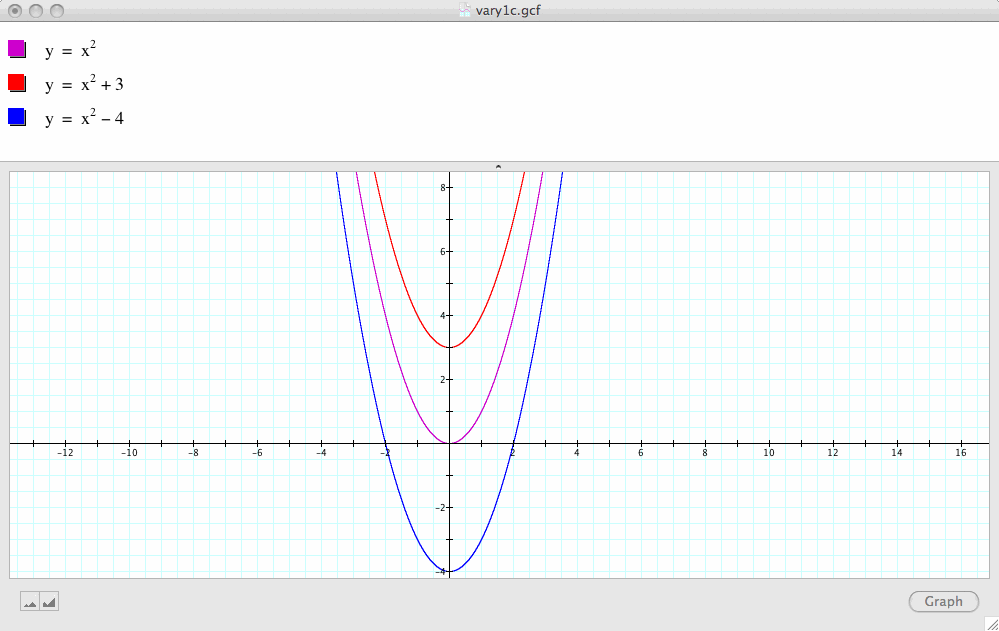
Conclusion 3: It seems obvious that changing the value of c causes a verticial shift of the graph.
As c increases, the parabola shifts upward. As c decreases, the parabola shifts downward.
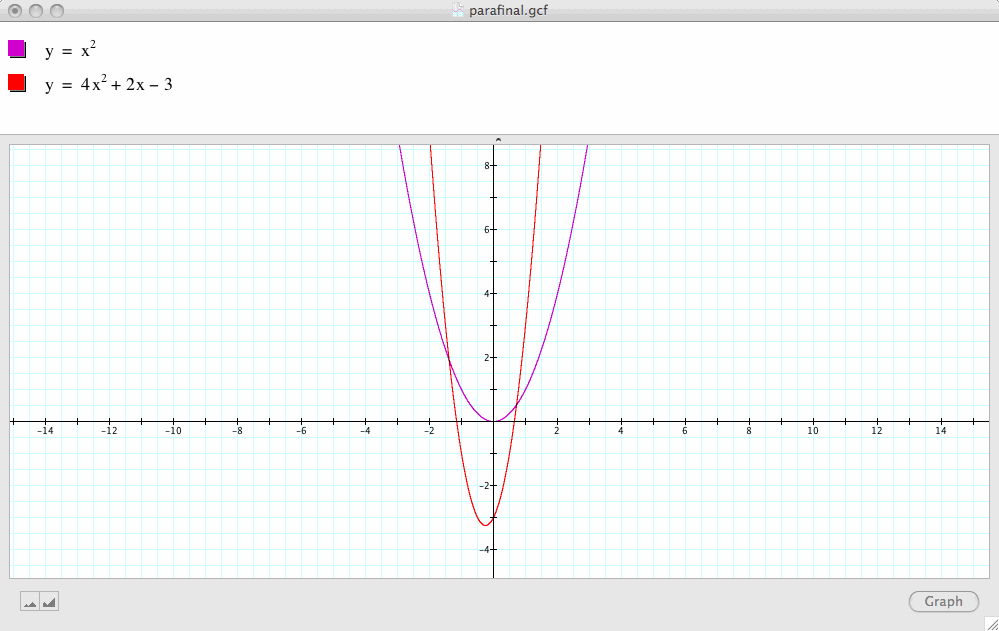
Finally, it's time to put everything together!
What do you think is the relationship between
![]()
and
![]() ?
?
Based on the above three conclusions,
(1) we know that a=4>1, so this parabola must open up and be narrower than ![]() .
.
(2) We also know that b=2>0, so the vertex of this parabola travels to the left of the vertex of ![]() .
.
(A side note: in fact, if you rewrite the equation in this question using the formula  ,
,
we get  , so the vertex of this parabola is at
 , i.e.,
 .
.
But the vertex of ![]() is at (0, 0), so it is obvious that
is at (0, 0), so it is obvious that  lies to the left of (0,0).)
(3) And we also know that c=-3<0, so this parabola is 3 units lower than ![]()
Now check the following graph and see if you got it right :-))
