Brenda King
Parametric Curves
Introduction:
Parametric curves use a
function to define the coordinates (x,y) for any point on a curve. Usually the function is based on t for time.
As t changes the path of the graph changes and can be mapped out. This investigation will vary the parameters a
and b in the equations
x=cos (at)
and y = sin (bt) for 0 < t <
2p.
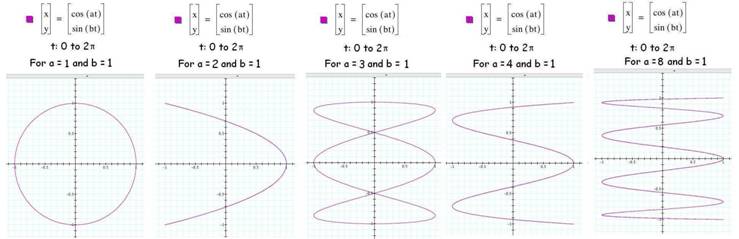
Change parameter a holding
b=1
The boundaries, or extent, of
these graphs appears to be a square area the size of a 1 by 1. Is there a consistent pattern in the
curves?
In diagram 1, the first two
graphs look like the familiar unit circle and parabola. Doing the conversion from parametric to
rectangular form should verify this to be the case.
The other graphs however are
more interesting. It would appear the
number of times the graph reaches the outer boundary, a loop, depends on the
values of a or b. The number of side loops depending
on a and the number of top loops depending on b.
With b=1,
there is one loop along the top of each graph.
The number of loops along the side appears in the graphs below agree
with the value of a with 1, 2, 3, 4, and 8 loops.
Diagram 1
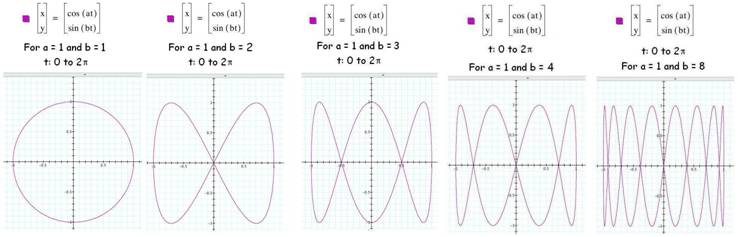
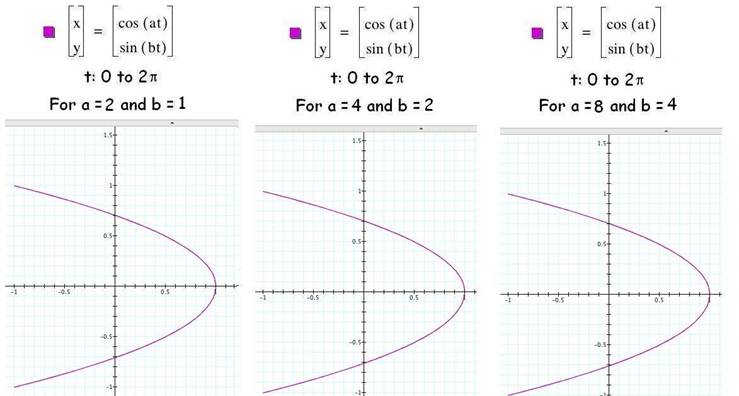
Change
parameter b holding a=1
In a likewise manner, with a=1,
there is one loop along the side of each graph and the number of loops along
the top are 1, 2, 3, 4, and 8 loops.
Diagram 2
Parameter a = b
When the two parameters are equal, then
the graph stays a circle. For example,
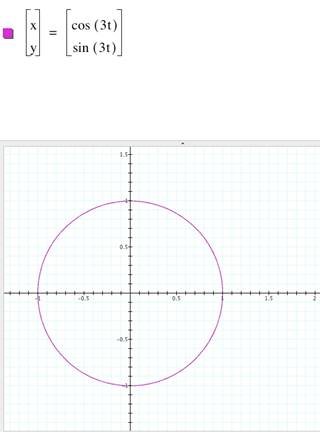
NO common factors in
parameters
I found some consistent graphs
supporting the idea that loop counts are linked to parameters a
and b .
Diagram 3
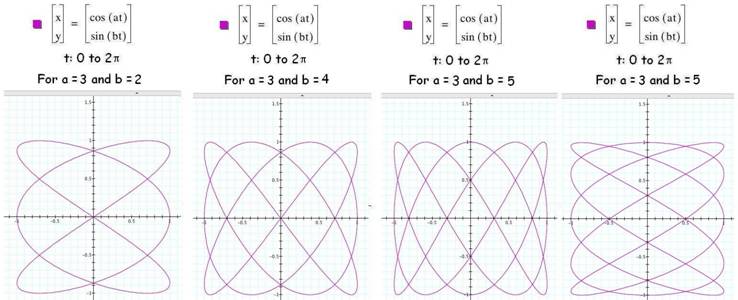
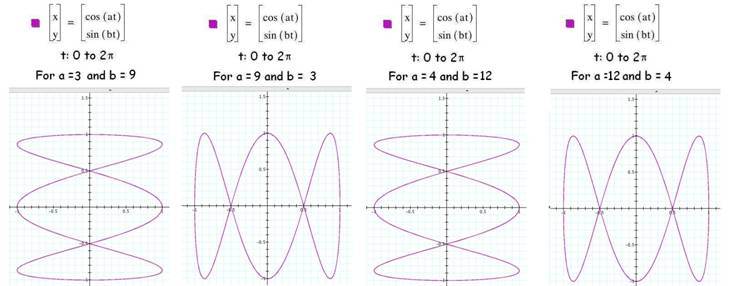
Parameter with common factors
of two
However, when the parameters have
something in common, then the number of loops is reduced by the common
factor.
Diagram 4
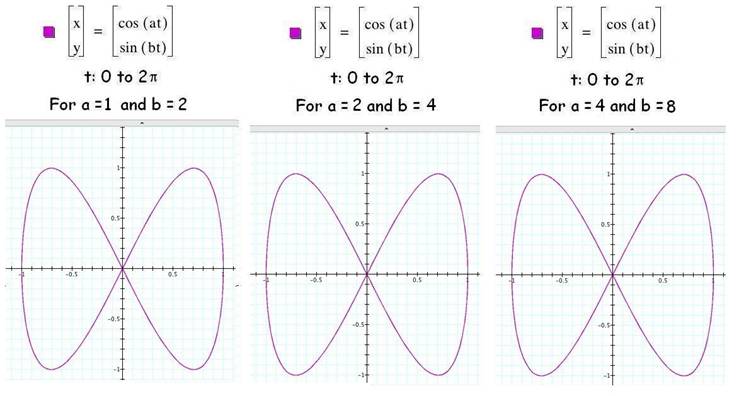
Parameter with common factors
of three
In the case of odd factors, the exchange
of a and b values orients the graph in a 90 degrees
rotation.
Diagram 5