

Assignment 1: Exploration of Sine Function
Ebru Ersari
Examine graphs of y = a sin(bx + c) for different values of a, b, and c.
Let's first start to explain how the different a, b, c values affect the y = a sin(bx+c) by changing the a value. Here are the graphs for a = -2, -1, 1, 2. (b = 1, c = 0)
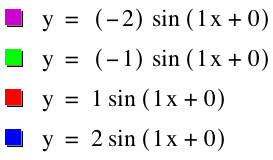
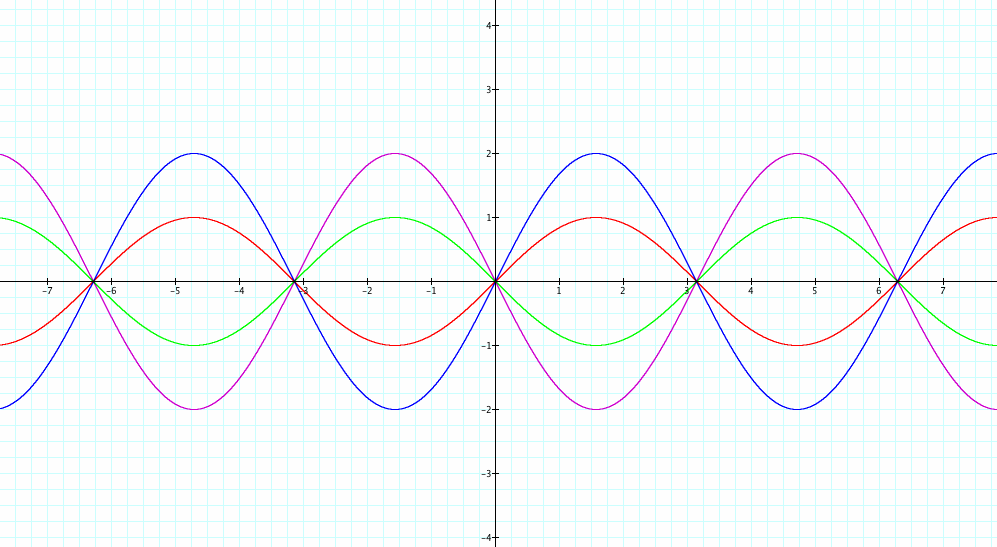
The Absolute Value of a: When we change our a value, the graph’s amplitude changes, as well. The larger absolute value of a creates a larger amplitude (without changing the b and c values).
The Sign of the Value of a: When we compare two sine functions with opposite sign a values, both graph’s amplitude are the same. However, one graph takes place in the upper part of the x axis and the other takes place above the x axis. The sign reflects the graph over the x axis.
Here is the animation showing how changes in a value affects the y = a sinx graph. (b = 1, c = 0)
Now, let’s change only the b value and see how the graph will change depending on the b value. Here are the graphs for b = -2, -1, 1, 2 (a = 1, c = 0).
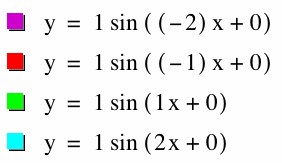
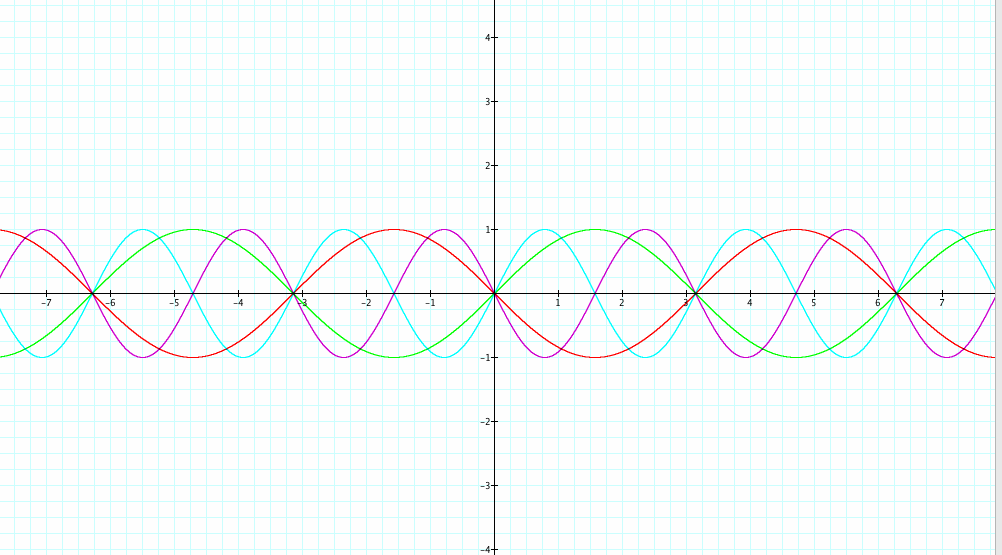
The Absolute Value of b: Our b value indicates the number of periods in an interval length of 2. The formula to find the period of a sine function is ![]() .
.
For y = sin x, the period is ![]() . The number of period is 1 for y = sin x function.
. The number of period is 1 for y = sin x function.
For y = sin 2x, the period is ![]() . The number of period is 2 for y = sin 2x function.
. The number of period is 2 for y = sin 2x function.
The larger absolute value of b has the more number of periods in an interval of length ![]() (without changing the values of a and c).
(without changing the values of a and c).
The Sign of the Value of b: When we compare two sine functions with opposing b values, the number of periods in an interval length of ![]() are the same. However, one graph takes place in the upper part of the x axis and the other takes place below the x axis. The sign reflects the graph over the x axis.
are the same. However, one graph takes place in the upper part of the x axis and the other takes place below the x axis. The sign reflects the graph over the x axis.
Here is animation that shows what happens when we change only the b value and keep the a and c values the same (a = 1, c = 0).
Then, let’s see how different c values change the graphs of the y = a sin(bx + c) function. Here are the graphs for c = -2, -1, 0, 1, 2 (a = 1, b = 1).
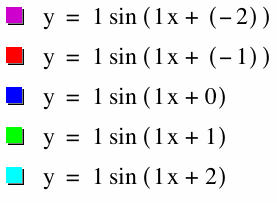
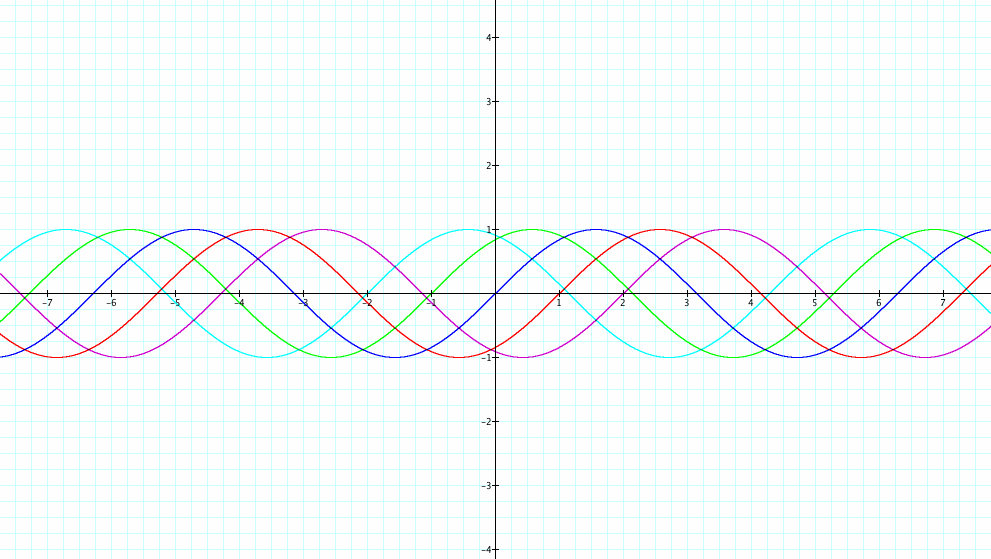
The Absolute Value of c: Our c value affects the phase shift. The formula to find the phase shift is -c/b.
For y = 1 sin (1x+ 1), the phase shift is -1/1 = -1.
For y = 1 sin (1x+2), the phase shift is -2/1 = -2.
If -c/b < 0, the shift will be to the left. If -c/b >0, the shift will be to the right. In our graphs, we see that y= 1 sin (1x+1) and y = sin (1x+2) shifted to the left and y = 1sin (1x + (-1)) and y = 1 sin (1x+ (-2)) shifted to the right.
The larger absolute value of c shifted the graph more.
The sign of the Value of c: When we compare two sine functions with opposing c values, the direction of the shift changes to the left or right depending on the sign of the c value.
Here is animation that shows how changes in the value of c affects the y = a sin(bx+c) graph (a = 1, b= 1).
In general, for y = a sin(bx+c), the value of a is the amplitude, ![]() is the period and -c/b is the phase shift.
is the period and -c/b is the phase shift.