

Assignment 1
Exploration of Logarithmic Functions
by
Kaitlin Spooner
Examine Graphing Calculator 3.5 graphs of
y = ln x
y = log x
Evaluate ln e and log 10. Also consider various values of a and b for
y = a (ln x)
y = ln (bx)
y = a (log x)
y = log (bx)
What is a logarithmic function? What does its graph look like? The logarithmic function, ![]() , is spoken as "the log, base a, of x." The logarithmic function is the inverse of the exponential function, so one can also think of logarithms by using exponential form.
, is spoken as "the log, base a, of x." The logarithmic function is the inverse of the exponential function, so one can also think of logarithms by using exponential form. ![]() is the same operation as thinking "a to the y power equals x." The common logarithmic function, written y = log x, has an implied base of 10. The natural logarithmic function is y = ln x. It is equal to the logarithmic function with a base e,
is the same operation as thinking "a to the y power equals x." The common logarithmic function, written y = log x, has an implied base of 10. The natural logarithmic function is y = ln x. It is equal to the logarithmic function with a base e, ![]() . This can be thought of as "e to the y power equals x."
. This can be thought of as "e to the y power equals x."
Here we have the basic graphs of y = log x and y = ln x. The logarithmic function is in blue, and the natural logarithmic function is in red. The two graphs are very similar. Each has a domain of all real numbers greater than 0, and each has a range of all real numbers. We see an asymptote at x = 0, as any number raised to an very small exponent will approach 0 but never actually reach the value. The graph of y = log x approaches this asymptote quicker than the graph of y = ln x. Why does this occur? This is due to the fact that a base of 10 in y = log x is a larger number than e, the base of y = ln x, which is about 2.7. Also, both functions are increasing across their entire domain. The graph of y = log x increases at a slower rate than the graph of y = ln x since the base of 10 is larger than a base of e. Each has an x-intercept at x = 1, and the graphs intersect at this point. Algebraically, any number a raised to the zero power will equal 1, so the logarithm of any number at y = 0 is one.

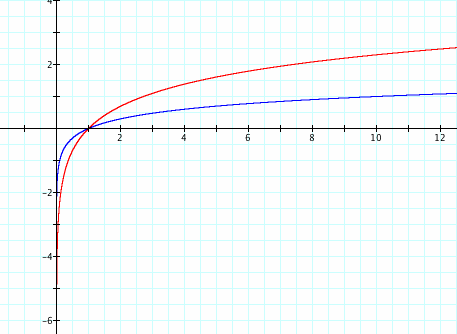
From this analysis, it can be concluded that as the base of a logarithmic function increases, the graph approaches the asymptote of x = 0 quicker. Also, the function may increase at a slower rate as the base increases. It can also be hypothesized that as long as there is no translation of the graph, the x-intercept will be at x = 1 and the asymptote will be at the line x =0. As we continue through this exploration, we will investigate these ideas.
Before we continue, we will evaluate a couple of values of logarithmic functions: log 10 and ln e. First, since the implied base of the common logarithm is 10, y = log 10 is equivalent to ![]() . Any number to the first power equals itself, so y = 1. As shown on the graph of y = log x above, there is a point at (10,1) which reflects this outcome. Next, we have the value of ln e. As discussed previously, ln e =
. Any number to the first power equals itself, so y = 1. As shown on the graph of y = log x above, there is a point at (10,1) which reflects this outcome. Next, we have the value of ln e. As discussed previously, ln e = ![]() e, so ln e is equivalent to
e, so ln e is equivalent to ![]() . Once again, since any number to the first power equals itself, y = 1. Therefore, we can conjecture that in any logarithm,
. Once again, since any number to the first power equals itself, y = 1. Therefore, we can conjecture that in any logarithm, ![]() , y = 1 if the base a and the value of x are equal.
, y = 1 if the base a and the value of x are equal.
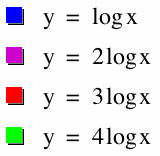
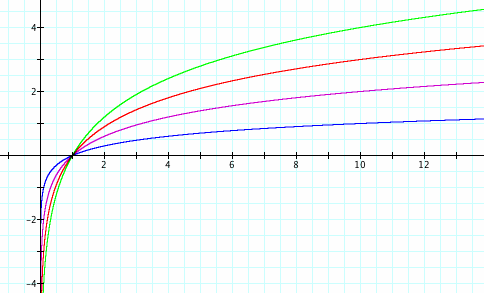
Now that we have iscussed ideas about the basic graphs of y = log x and y = ln x, we will consider using different values to modify the graphs. First, we will look at y = a (log x). How does the graph change as a changes? Here we can see that as a increases, the graph of y = a (log x) seems to grow more quickly. The y-values are increasing at a greater rate since each increase in a multiplies the log x function by a greater number. With this greater rate of increase, the larger a is, the slower the graph seems to approach its asymptote at x = 0. Lastly, each of these graphs has an x-intercept at x = 1. Why is this? Remember, we can think of a logarithm using exponents, and any number (here, base 10) to the 0 power (y = 0 on the x-intercept) equals 1. Therefore, when y equals 0, x equals 1.
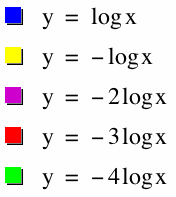
What if a is a negative number? The logarithmic function may look like the graph below. The negative in front of the function reflects the function over the x-axis, but all other properties of the logarithmic function hold. Here, as a decreases, the magnitude of a increases. As this happens, the graph decreases at a quicker rate as x increases.
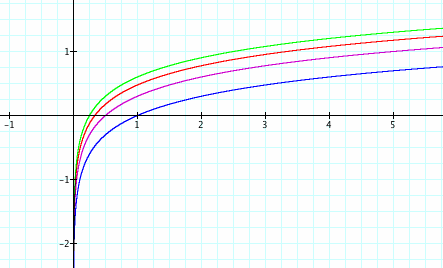
What if we multiply x by some value in y = log x? Here we will look at the function y = log(bx). All of the graphs seem to increase at the same rate, so b has a different effect on the graph compared to a in the graphs above. The b in front of the x seems to move the graph up, so the x-intercept does not equal 1, and it is possible that the graphs approach the asymptote at the same rate. Even though the graphs seem to increase at the same rate, they actually do not. When the magnitude of b is greater than 1, there is a horizontal compression on the graph. This is why the graphs seem to move up. If the magnitude of b is less than one, there is a horizontal stretch.
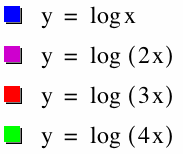
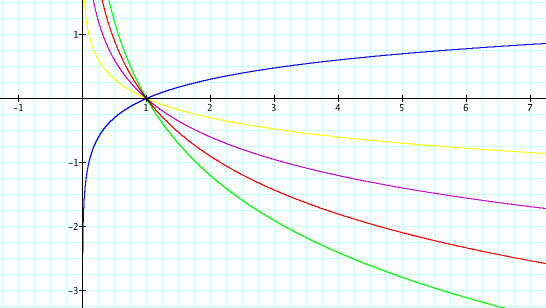
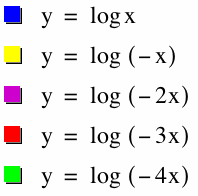
What if b is negative in the equation y = log(bx)? The b value has the same effect as above, except the negative reflects the graph over the y-axis.
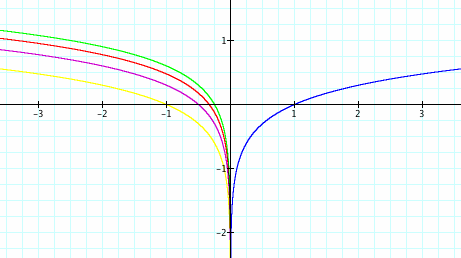
Next, we will look at the effects of a and b on y = ln x. What are your predictions for the differences in the graphs of y = a (ln x) and y = ln (bx) compared to the graph of y = ln x? How will they be similar or different from the graphs of y = a (log x) and y = log (bx), respectively? First, we will examine y = a (ln x). In our equations, a is represented as n, and n ranges from -5 to 5. The effects of a on y = ln x seems to be similar to those on y = log x. When a is negative, the graph reflects over the x-axis. As the magnitude of a increases, the graph decreases at a greater rate if a is negative or increases at a greater rate if a is positive.

Lastly, we will examine y = ln(bx). In the equations, b is represented as n, and n ranges from -10 to 10. The effects of b on y = ln x are similar to the effects of b on y = log (bx). When b is negative, the graph reflects over the y-axis. As the magnitude of b increases, the graph seems to grow and increase at a slightly greater rate. When the graph of y = ln (bx) has greater y-values than y = ln x, the graph has a horizontal compression. If the y-values of y = ln (bx) are less than those of y = ln x, there is a horizontal stretch.

Return to Kaitlin Spooner's homepage