

Assignment 2
Exploration of Quadratic Functions
by
Kaitlin Spooner
What happens to ![]() (i.e., the case where b = 1 and c = 2) as a is varied? Is there a common point to all graphs What is it? What is the significance of the graph where a = 0? Do similar interpretations for other sets of graphs. How does the shape change? How does the position change?
(i.e., the case where b = 1 and c = 2) as a is varied? Is there a common point to all graphs What is it? What is the significance of the graph where a = 0? Do similar interpretations for other sets of graphs. How does the shape change? How does the position change?
The standard form of a quadratic equation is written as ![]() where a, b, and c are coefficients. What happens when we change the value of a in a quadratic function? Here we have the graph of
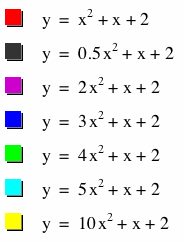
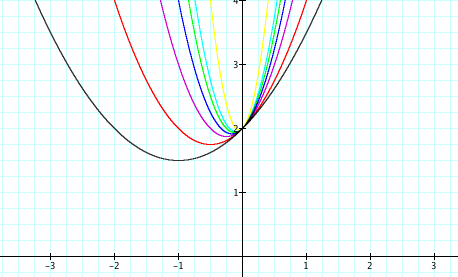
where a, b, and c are coefficients. What happens when we change the value of a in a quadratic function? Here we have the graph of ![]() , so we vary a, b is equal to 1, and c is equal to 2. As a decreases, the parabola seems to open up more and become wider. As a increases, the graph becomes narrower. Each of these graphs has a different vertex, so the vertex is not a common point for the graphs. The vertex of a parabola is the maximum or minimum point on the parabola. For example, when a = 1 in the graph of
, so we vary a, b is equal to 1, and c is equal to 2. As a decreases, the parabola seems to open up more and become wider. As a increases, the graph becomes narrower. Each of these graphs has a different vertex, so the vertex is not a common point for the graphs. The vertex of a parabola is the maximum or minimum point on the parabola. For example, when a = 1 in the graph of ![]() shown in red, the vertex would be at the point (-.5, 1.75). There is a common point for each of these graphs. It is the point (0,2) which is the y-intercept for each of the graphs. This is because our c-value equals 2. This value in standard form gives the y-intercept. Since c is the same coefficient for each of these graphs, they share the same y-intercept as a common point.
shown in red, the vertex would be at the point (-.5, 1.75). There is a common point for each of these graphs. It is the point (0,2) which is the y-intercept for each of the graphs. This is because our c-value equals 2. This value in standard form gives the y-intercept. Since c is the same coefficient for each of these graphs, they share the same y-intercept as a common point.
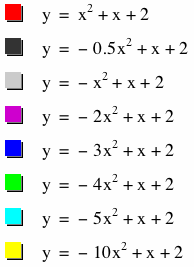
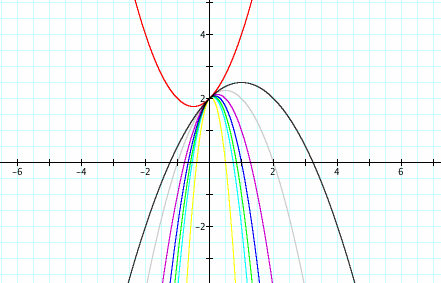
What if a is negative? The parabolas now open down instead of opening up. Otherwise, the same phenomena arise as before. As a increases, the a-value gets closer to zero instead of farther away from zero. This is different from our previous situation of when a is positive because as a increases in that situation, it gets farther away from zero. Here, instead of discussing when a increases and decreases, we must discuss when the magnitude of a increases and decreases. As the magnitude of a decreases, the graph widens. As the magnitude of a increases, the graphs become more narrow. Each of these graphs has a different point as its vertex, but again, they share the common y-intercept at the point (0,2). This shows that even as a changes, the common point of the y-intercept remains constant, and it appears to be a result of the value of c.
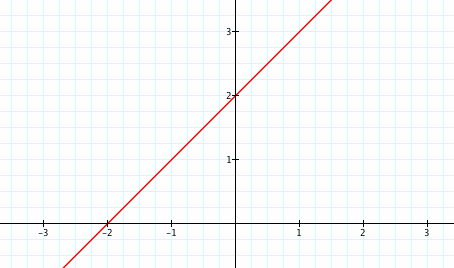
What if a = 0? What are your predictions? Here we see a graph where a equals zero. The graph is now linear instead of quadratic, so it is a straight line instead of a parabola. Algebraically, we can verify this. When ![]() is multiplied by 0, the term then equals zero. We are left with y = 0 + x + 2 = x + 2. The degree of this function is now 1, so the function must be linear. In order to be a quadratic function and graph a parabola, the degree of the polynomial must be 2. Therefore, when a equals 0, we have a linear function. Even though the type of the function changes, we still have the same y-intercept at y = 2. The c-value in our equation is still 2, and if we just considered our function y = x + 2 in slope-intercept form of a linear equation, we can see that the y-intercept is still 2. It is also interesting to note that the slope of this line is 1, which is our b-value in our original parameters for our quadratic equation.
is multiplied by 0, the term then equals zero. We are left with y = 0 + x + 2 = x + 2. The degree of this function is now 1, so the function must be linear. In order to be a quadratic function and graph a parabola, the degree of the polynomial must be 2. Therefore, when a equals 0, we have a linear function. Even though the type of the function changes, we still have the same y-intercept at y = 2. The c-value in our equation is still 2, and if we just considered our function y = x + 2 in slope-intercept form of a linear equation, we can see that the y-intercept is still 2. It is also interesting to note that the slope of this line is 1, which is our b-value in our original parameters for our quadratic equation.
![]()
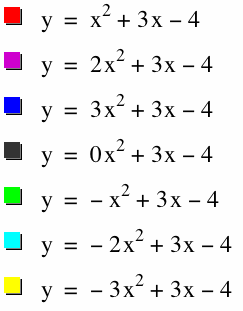
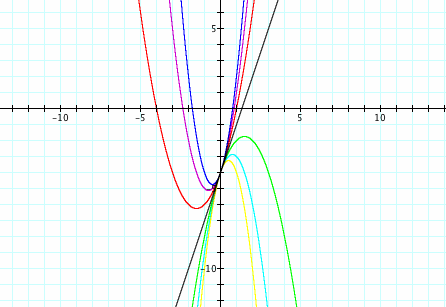
Now let b = 3 and c = -4. What are your predictions for how this set of graphs will look? Will they change position or shape compared to the graphs above? How will these graphs change as a changes? Here we observe the same ideas as before. If a is positive, the parabolas open up, and if a is negative, the parabolas open down. If a = 0, we have a straight line that is a linear function. As the magnitude of a decreases, the graphs widen, and as the magnitude of a increases, the graphs become more narrow. Each of the parabolas has a different vertex, and but they still have a common point on the y-axis. This common y-intercept has changed position compared to our previous graphs. Here, the y-intercept is at the point (0,-4). The coefficient c equals -4, so our earlier predictions that the common point is the y-intercept at the value of c hold. The linear function where a = 0 also shares this common point. These graphs also seem to change shape compared to our previous graphs. Each graph is slightly narrower than our previous graphs, which can be attributed to the change in the b-value. The b-value is greater in this set of parabolas, so the parabolas increase and decrease at a greater rate. This can also be shown in our linear function. The linear function here has a steeper slope of 3, which is our b-value in our original set of equations. Since this line has slope with a greater magnitude than in our previous set of parabolas, it can be concluded that the graphs increase and decrease at a greater rate since the b-value has a greater magnitude.
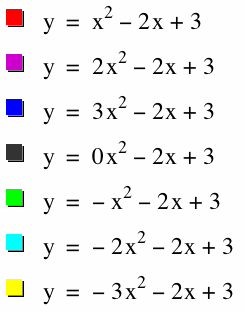
Lastly, let b = -2 and c = 3. How will these graphs change? Here, each graph still has a common y-intercept at the point (0,3). Once again, this y-value is equal to the value of c. The linear function also has this common y-intercept. These graphs also change shape compared to our previous graphs. Each graph is slightly wider than our last set of graphs. Here, the magnitude of the b-value is less, but it is also negative. The parabolas that open up switch to be on the opposite side of our straight line since the slope of our straight line is negative. Then the greater y-values for the parabolas with a positive a-value that open up must be on the opposite side of the straight line.
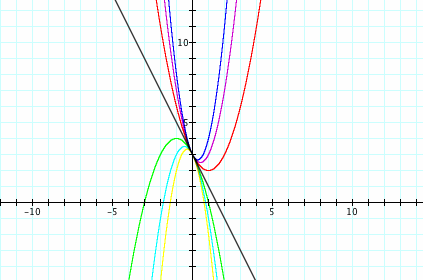
In conclusion, as the magnitude of a increases, the graph of the parabola becomes narrower, and as the magnitude of a decreases, the graph of the parabola becomes wider. If a is negative, the graph of the parabola opens down instead of up. The b-value of a parabola helps to determine the rate at which the parabola increases and decreases, and it also helps to determine the position of the vertex of the parabola. The c-value determines the y-intercept of a quadratic function.