
Exploring Polar Equations
by
Julie Anne Laycock
Investigate ![]()
compare with ![]()
First, lets look at what happens for different values of a,b, and k.
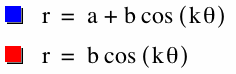
a=1, b=1, k=1
When we set a, b, and k at 1 in the first equations we get a graph that looks like a sideways heart. When we set a, b, and k at 1 in the second equation we get what looks like a circle that is inside the first graph.
Now we are going to see what happens when we change a and b.
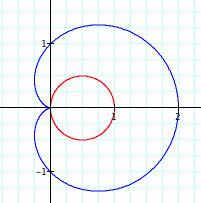
a=-2, b=-2,k=1
When we change a and b to 2. The graph is increased by that factor and it is also flipped over the y axis because we put in -2 for a and b.
Now, let's set a and b set at 2 and see what happens when we change k.
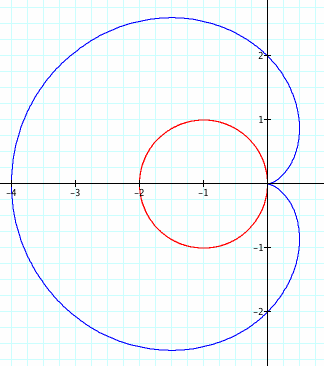
a=2, b=2, k=2
In this case we change k to 2. We can see the first equation or the blue graph has two leaves while the second equation or the red graph has four.
Again, let's keep a and b at 2 but increase k to 3.
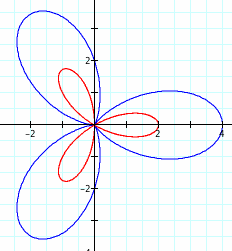
a=2, b=2, k=3
We can see that both the blue and the red graph have three leaves. This time both graphs have the same amount of leaves as the value of k.
Now let's look at what happens to the graph when k is 4.
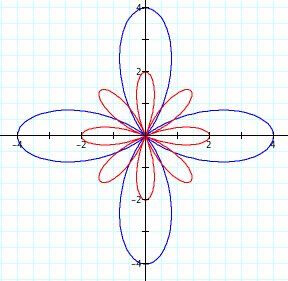
a=2, b=2, k=4
We can see that the first equation or blue graph has 4 leaves, the same value as k. The second equation or the red graph has 8 leaves, double the value of k.
Let's look at an animation for a range of k.
In this animation k is ranging from 0-10 for both equations. We can see when k changes in the equation ![]() , the blue graph, we get the same amount of leaves as the value of k. However, when k changes in the equation
, the blue graph, we get the same amount of leaves as the value of k. However, when k changes in the equation ![]() , the red graph, we get double the amount of leaves as the value of k.
, the red graph, we get double the amount of leaves as the value of k.
Finally, let's look to see what happens if we replace cos with sin for both equations.

When we replace cos with sin for both equations the graph is shifted. Lets explore what happens when we change k. Will the same thing happen when we change the values of k as what happened with cos?
Let's have the value of k to be 2.
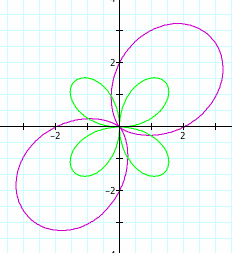
k=2
We can see what the same thing happened as what happened with the graph of cos. The first equation or the purple graph gave us the same amount of leaves as the value of k. The second equation or the green graph gave us the double the amount of leaves as the value of k.
Let's look at the sin and cos graphs together in an animation ranging k from 0 to 10.
We can see our graph of both the cos and sin graphs overlapping makes nice graph of a flower.