
Exploring Parametric curves
by
Julie Anne Laycock
For various values of a and b investigate the equations: 
In this animation, I have designated a and b to change from 0 to 7. We can see that as a and b are the same value and as they increase from 0 to 7 a circle is being formed. In this case the circle is formed starting at 1 on the x-axis and moving counterclockwise crossing the x-axis again at -1 and the y-axis at 1 and -1.The circle becomes a complete circle when a and b somewhere between 6 and 7. If we continue to have a and b the same and increase their value, the circle will continue to follow the counterclockwise path and overlap.
In this animation, I have designated a and b to change from -7 to 0. We can see that as a and b are the same value and as they increase from -7 to 0 a circle is being formed. In this case the circle is formed starting at 1 on the x-axis and moving clockwise crossing the x-axis again at -1 and the y-axis at 1 and -1. The circle becomes a complete circle when a and b somewhere between -6 and -7. If we continue to have a and b the same and decrease their value, the circle will continue to follow the clockwise path and overlap.
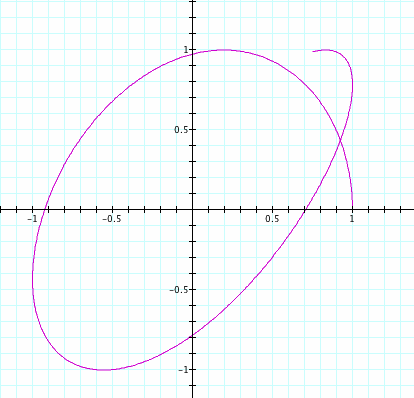
Now lets look at what happens when a and b are different. In this case I have a at 7 and b at 8.

When a and b were the same value greater than 7 we would expect a circle but when we change the value of b to 8 we can see the graph has changed. The graph looks like it starts to form a circle but moves towards forming an ellipse.
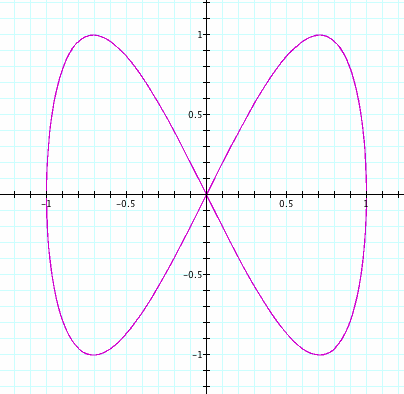
Now lets look at what happens when we keep a at 7 and change b from 0 to 100.
As we can see the graph makes a curve that runs horizontally on the x-axis from -1 to 1 and the curve also doesn't go higher or lower than 1 or -1 on the y-axis. It appears that the curve will continue making the same curve but would move closer and closer together.
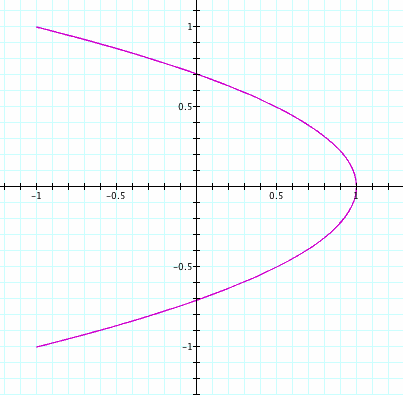
Now lets look what happens when we keep b at 7 and change and change a from 0 to 100.
As we can see the graph makes a curve that runs vertically on the y-axis from -1 to 1 and the curve also doesn't go left or right than 1 or -1 on the x-axis. This curve looks the same as the one above only now its running on the y-axis versus the x-axis.
Taking a closer look at the graphs we can make a couple of interesting observations. We can see when b is double the value of a we will get the graph on the left every time. Also, when b is half the value of a we will see a graph like the one on the right.

