
Exploring Quadratic Equations
by
Julie Anne Laycock
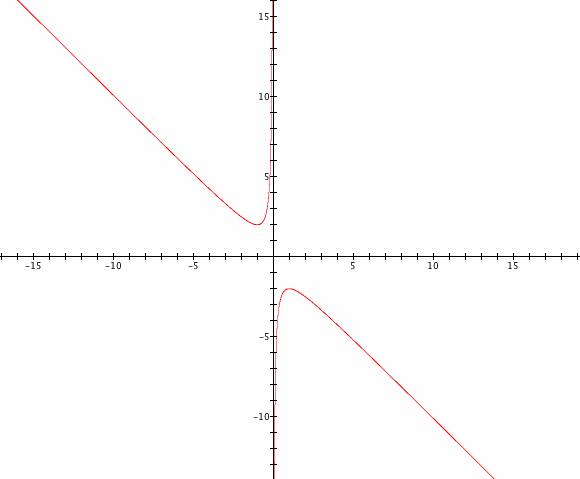
Consider graphs in the xb plane. Consider the equation: ![]() .What happens when we change c?
.What happens when we change c?
The graph of ![]() in the xb plane shows the pattern of roots.
in the xb plane shows the pattern of roots.
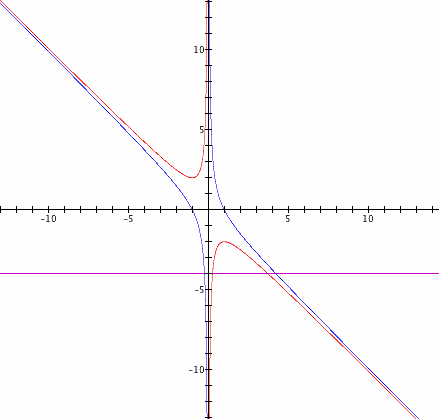
We see by the graph below when we set b equal to a number we get a horizontal line. The animation shows the when the value of b is moved from 5 to -5. We can see that based on the graph there are two values of x are negative when b is greater than 2. When b is equal to 2, x has only one negative root. When b falls between 2 and -2 there are no real roots for x. When b is equal to 2 there is one positive root for x. When x is greater than 2 there are two positive roots for x.
Now lets look at what happens when we change the values for c. First lets look if c = -1.

We can see that the pattern of roots has changed and as we change the value of b we will have two roots for every value of b. For each value of b there is one positive and one negative root.
Now lets look at other values of c. First lets look if c = 2 and c = -2.

We can see changing c to 2 and -2 shifted the graph. The new graph moves up and down from the original graph when we use c at 2. The new graph moves left and right from the original graph when we use c at -2.
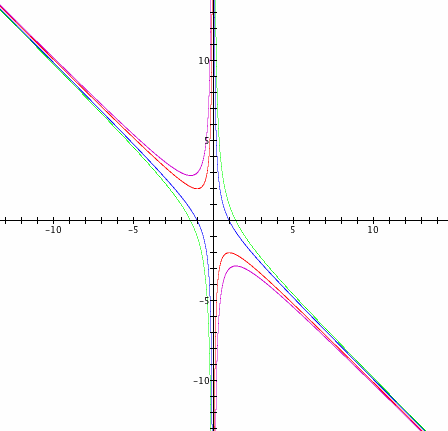
Now lets look at c changes from -30 to 30.
We can see as c gets bigger and smaller the new graph continues to move away from the original graph but it looks like something is happening when c falls between 0 and 1.
Now lets look at what's happening when c falls between -1 and 1.
We can see that as c gets closer and closer to zero the curves approach each other until they meet and form two straight lines.

We can see when c = 0 the graph shows the asymptotes for the original graph.