

Exploring Spreadsheets
by
Julie Anne Laycock
Write a function given the data.
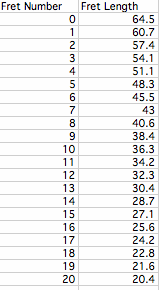
The set of data is formed by measuring the length of a guitar string from a fret to the bridge of the guitar. the open string can be though of as "fret 0", and the length of the open string is the initial measurement. Then make measures for frets 1, 2, ..., 22 and plot a graph of the points where the fret number is the x coordinate and the length is the y coordinate.
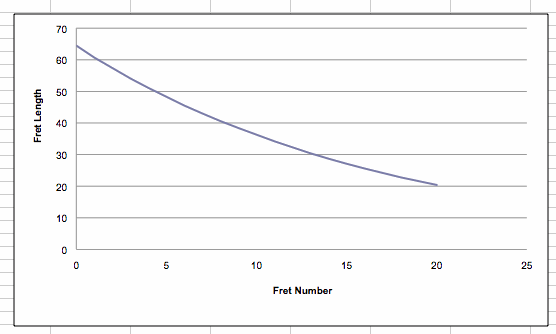
The graph was generated from Excel. As we can see the fret number is on the x axis and the fret length is on the y axis. It appears that there is a strong, negative linear relationship between fret length and fret number. We will use Excel to do a linear regression analysis.
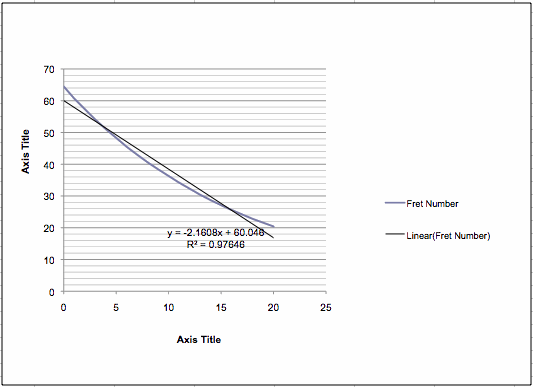
The data can be expressed as the function: ![]()
with an r squared of 0.97646 which means that 97.646% of the variability of y is explained by the variability of x.
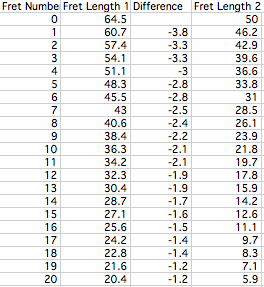
What if we started with an instrument with a shorter neck? Let's use 50 cm for the length from fret 0.
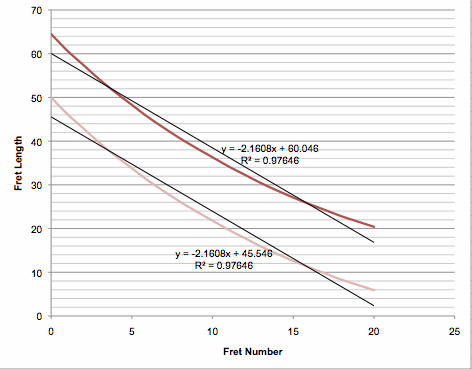
We can see we have the same slope and the same r squared value. The only thing that changed was the intercept value.