
Exploring Quadratic graphs
by
Julie Anne Laycock
y =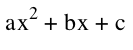
Fix two values of a, b, c. Make 5 graphs on the same axes as you vary the third value.
First, let's start by looking at what happens when we set a and b but change the third value c.
I chose to fix a=1 and b=1 while changing c=1,-1,3,-3,5,-5. As we can see changing c shifts the graph up and down. When c is positive the graph shifts up and when c is negative the graph shifts down.
The animated graph shows the graph shifting up and down as c ranges from -10 to 10.
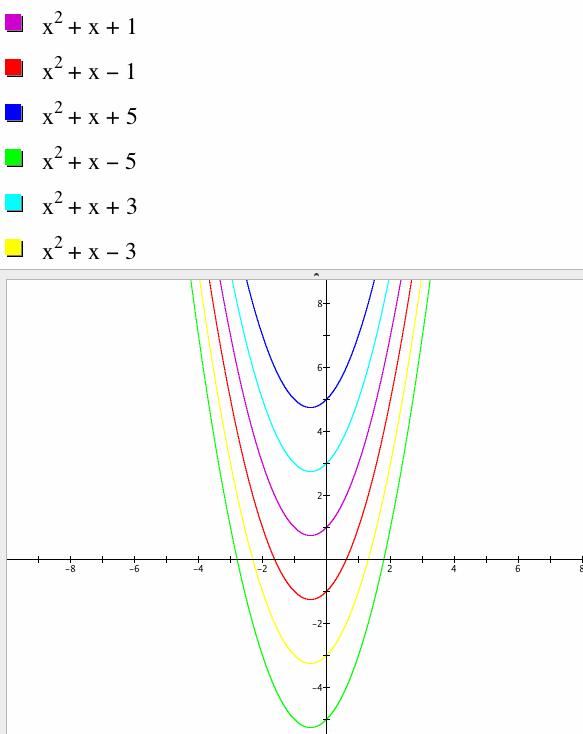
Now let's look at what happens when we set a and c but change the second value b.
I chose to fix a=1 and c=1 while changing b=1,-1,3,-3,5,-5. As we can see changing b shifts the graph left and right as well as up and down.
The animated graph on the right shows the path of the parabola as b ranges from -10 to 10. We can see that the graph appears to follow a path that appears to be a parabola. We also observe that the graph is always crossing the y-axis at (0,1). When x is zero the y-intercept will always be c. This is why the parabola is always sliding through this point.
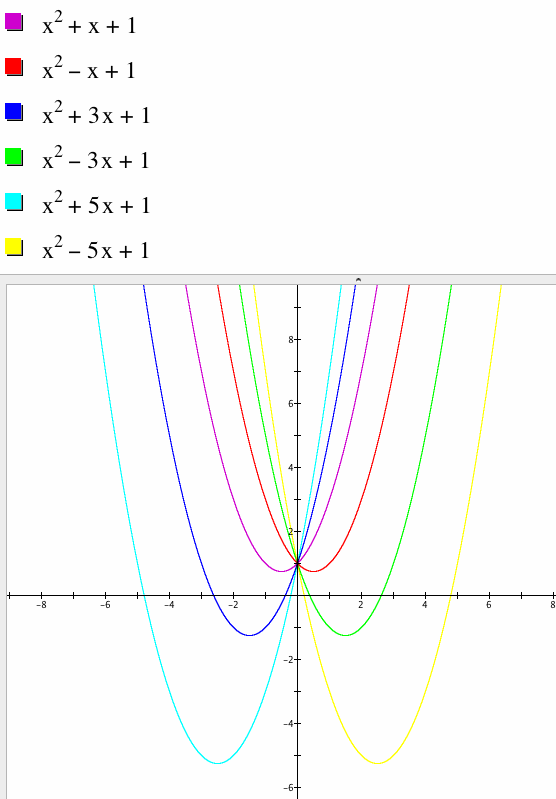
Finally, let's look at what happens when we set b and c but change the first value a.
I chose to fix b=1 and c=1 while changing a=1,-1,3,-3,5,-5. As we can see changing a stretches and flattens the graph. When a is a number greater than one the graph stretches more and more as the number gets bigger. When a is a number less than one the graph also stretches but it also flips.
We can in the animated graph as a moves closer and closer to zero and falls between one and negative one the parabola flattens until it reaches zero where the parabola becomes a straight line.