Assignment 1: Exploring Linear Functions
Presented by: Amanda Oudi
Problem: Make up linear functions f(x) and g(x). Explore, summarize, and illustrate with different pairs of f(x) and g(x) the graphs for
i. h(x) = f(x) + g(x)
ii. h(x) = f(x) * g(x)
iii. h(x) = f(x) / g(x)
iv. h(x) = f(g(x))
Discussion:
Before investigating the problem, let's first make a few predictions about how the graphs of the resulting functions will look like. Using the general form of a linear equation, let f(x) = ax + b and g(x) cx + d. Then the sum of these two functions is h(x) = (ax + b) + (cx + d) = (a+c)x + (b+d). So the resulting function is another linear equation with slope a + c and y-intercept b + d. The product yields h(x) = (ax+b) * (bx+d) = acx2 + (ad + bc)x + bd, thus producing a parabola. We know that if ac > 0 then the parabola will open up and if ac < 0 the parabola will open down. The quotients gives h(x) = ax+b / cx + d, which will result in a rational function. In particular, the quotient produces a special type of rational function: a hyperbola. This is because of the existence of the variable x in the denominator. We can determine where a horizontal asymptote will exist simply by comparing the ratio of leading coffeficients since the degree of f(x) and g(x) are the same, i.e. the horizontal asymptote is given by y = (numerator's leading coefficient) / (denominator's leading coefficient). We can also determine where a vertical asmptote will exist simply by examining the zeroes of the denominator of the rational function h(x). We know that we cannot have a zero in the denominator of a rational function, otherwise a graph wouldn't exist, so setting cx + d = 0 tells us that x cannot be -d/c. Lastly, the composition yields h(x) = acx + ad + b, thus producing another linear function with slope ac and y-intercept ad + b. Now that we have made some predictions, let's investigate using examples.
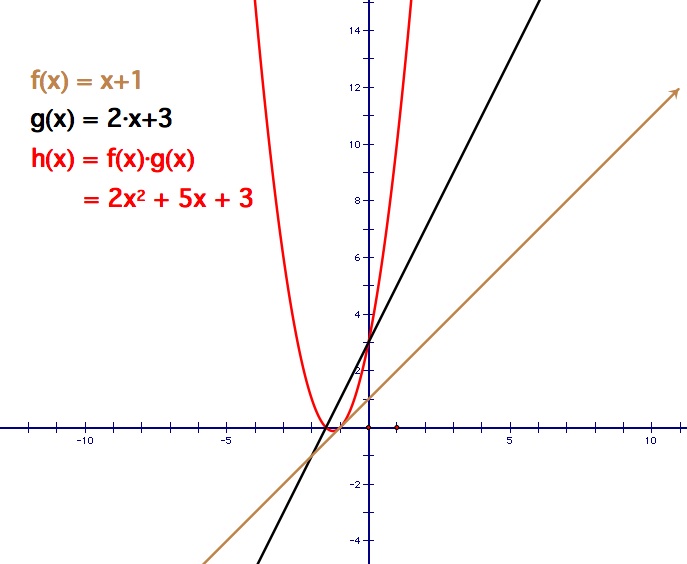
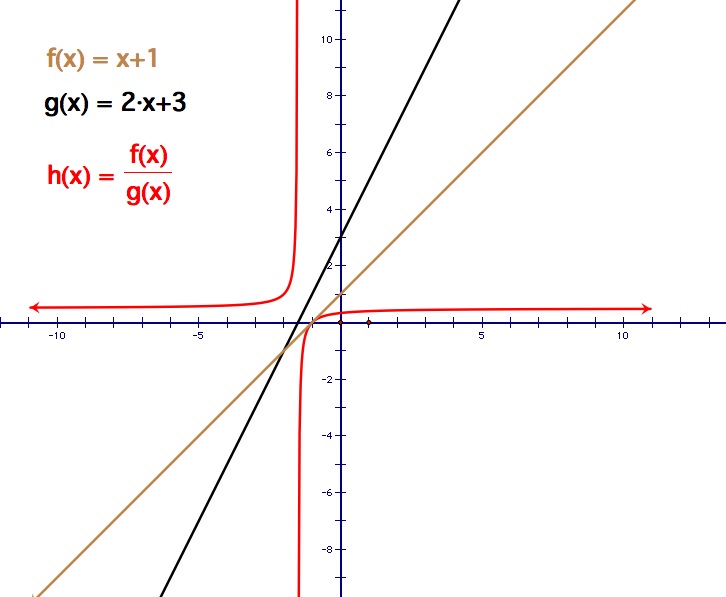
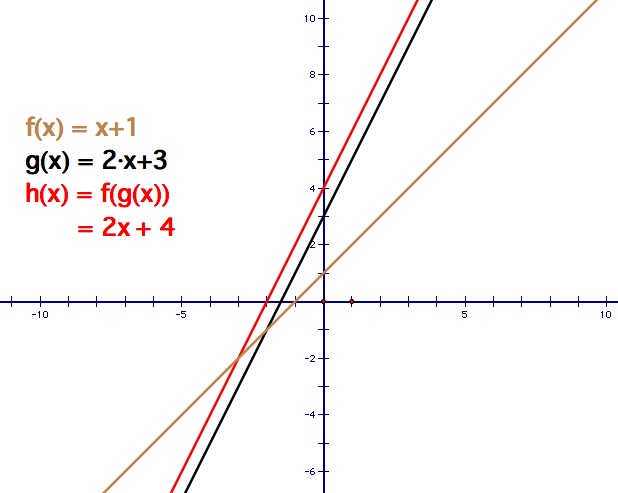
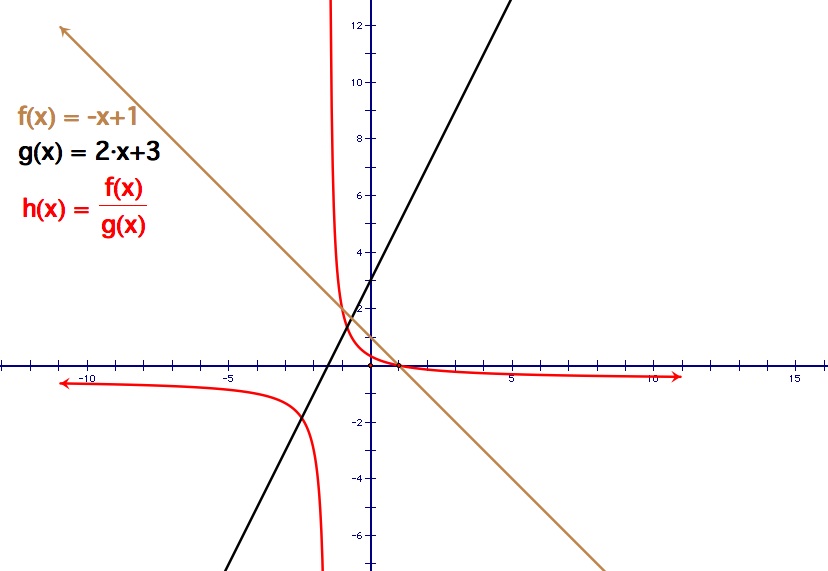
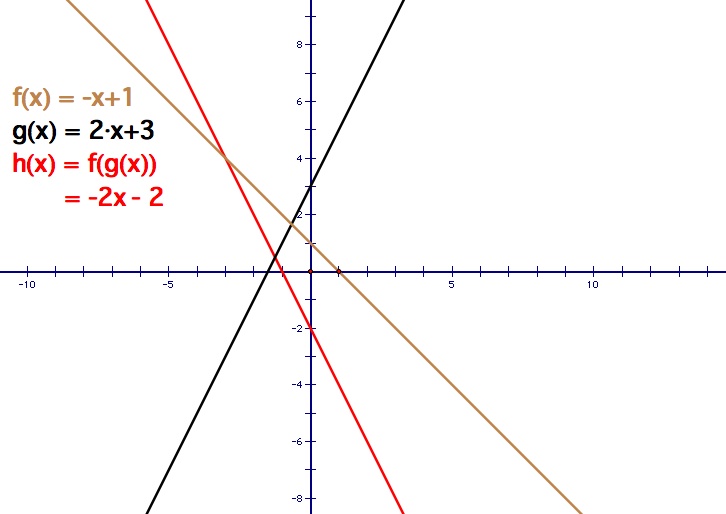
Example 1: Let f(x) = x + 1 and g(x) = 2x + 3
The graphs produced verifies the predictions we initially made. Adding two linear equations results in a new linear equation because the degree of the resulting polynomial remains unchanged when adding polynomials of the same degree. On the other hand, multiplying two linear equations yields a quadratic equation because multiplication of two polynomials of degree one yields a polynomial of degree two; hence, the graph is a parabola. An interesting observation is that the roots of the quadratic, which are x = -1 and x = -3/2, are the same as the x-intercepts of the linear equations f(x) and g(x) respectively. Dividing two linear equations yields a hyperbolic equation since it's in the form f(x) / g(x), where f(x) and g(x) are linear functions; thus, the graph is a hyperbola. Another interesting observation is that the x-intercept of g(x), which is x = -3/2, is the value of the vertical asymptote of the hyperbola; also, the horizontal asymptote occurs at y = 1/2. Another observation is that the x-intercept of f(x), which is x = -1, is the x-intercept of the hyperbola. Like addition, the composition of two linear equations yields a linear equation. The graph is a linear because the degree of the polynomial is unaffected when substituting g(x) into f(x).
Example 2: Let f(x) = - x + 1 and g(x) = -2x - 3
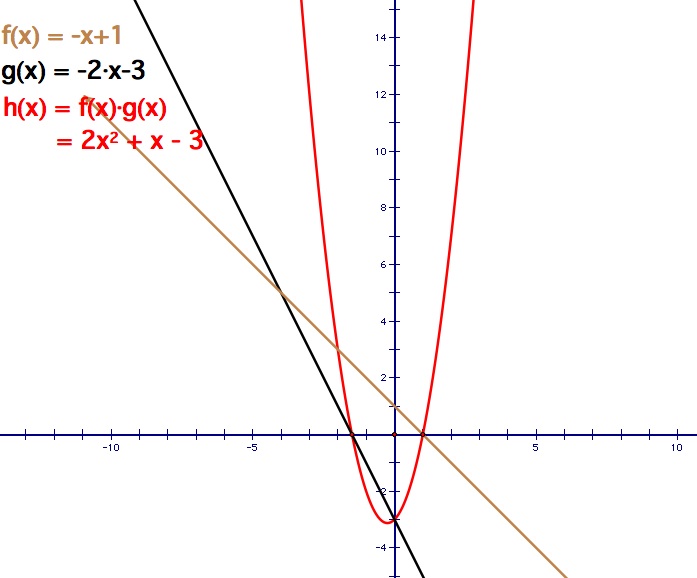
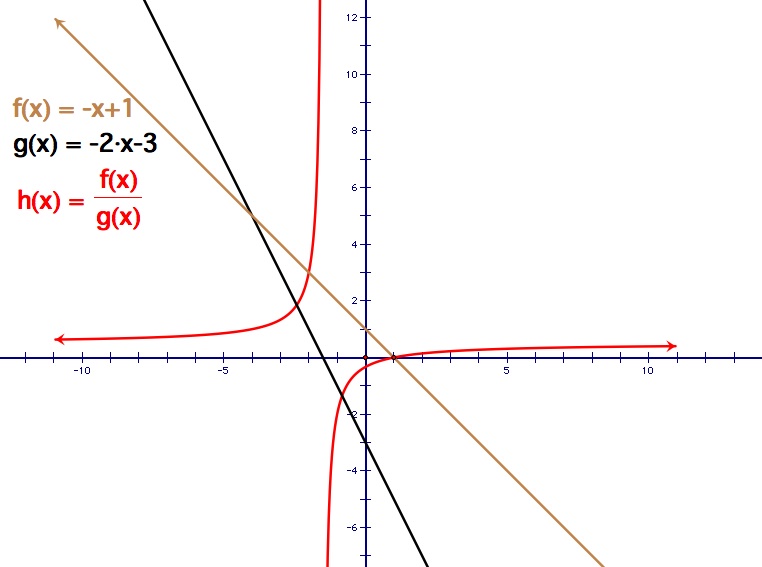
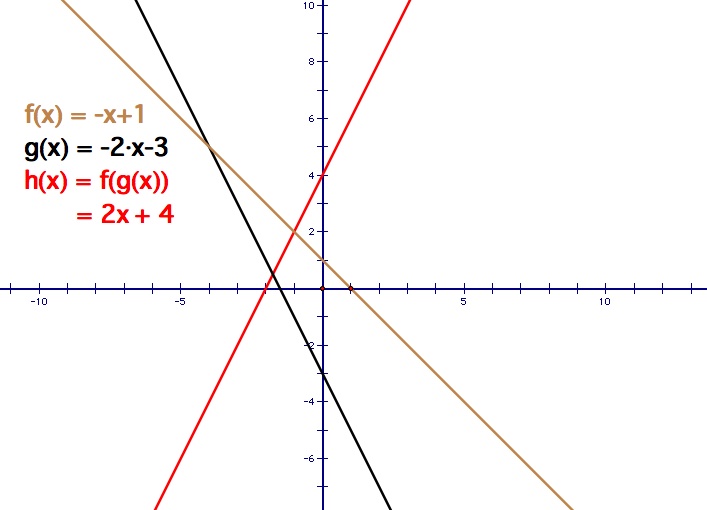
In this example, the slopes of both equations are negative. The results are much similar to Example 1. Addition of two linear equations produces another linear equation, i.e. a line. The multiplication of two linear equations yields a quadratic equation, thus producing a parabola. Again, the roots of the quadratic, which are x = 1 and x = -3/2, are the x-intercepts are f(x) and g(x) respectively. Dividing two linear equations yields a hyperbolic equation, so the graph produced is a hyperbola. The vertical asymptote is x = -3/2, which is the x-intercept of g(x), and the horizontal asymptote occurs at y = 1/2. Again, the x-intercept of f(x), which is x = 1, is the x-intercept of the hyperbola.
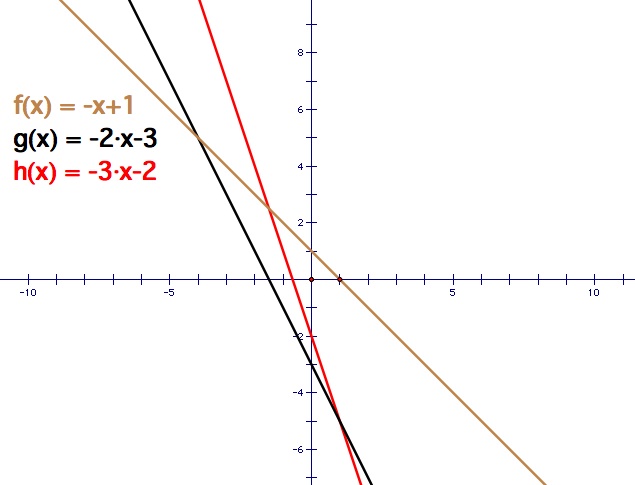
Example 3: Let f(x) = - x + 1 and g(x) = 2x + 3
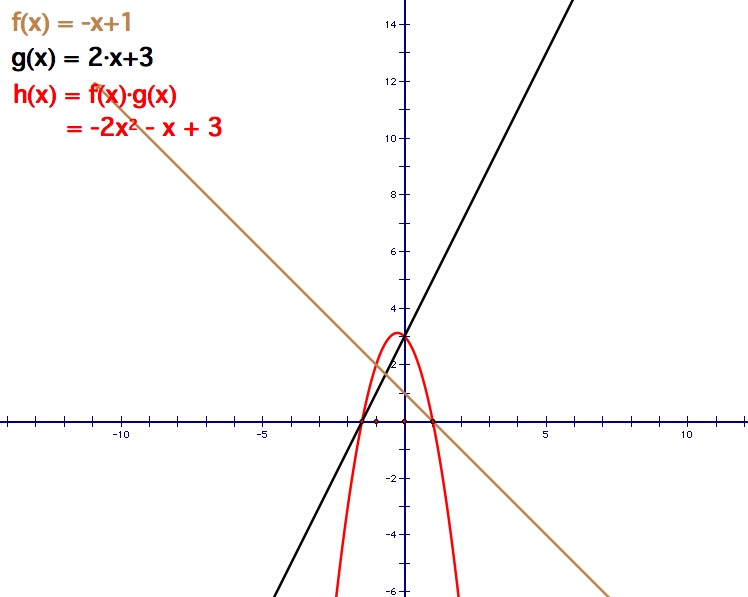
In this example, f(x) has a negative slope and g(x) has a positive slope. The most interesting case in this example is the multiplication case. In this instance, the parabola opens downward instead of upwards like the previous two cases. This is because we have a negative coefficient in front of x-squared term. The sign of the coefficient in front of the x-squared term indicates whether the parabola will open up or down.
Extensions:
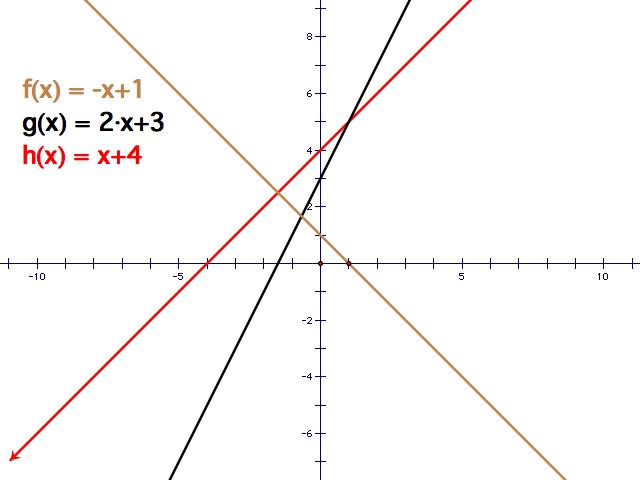
What would the graph look like for each case if f(x) = - x + 1 and g(x) = x + 4?
Instead of using linear equations for f(x) and g(x), investigate each case when f(x) and g(x) are trigonometric functions, such as sin(x) or cos(x).