Kate Berryman
cavaleri@uga.edu
*Please make sure your browser is maxiumized to view this write up;
Explore the graph of :
![]()
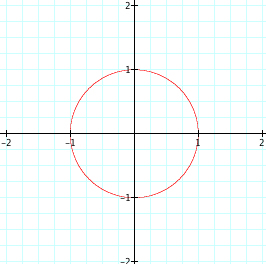
Let's begin n=2. We know this to be an equation of a circle with a radius of 1. As expected, we get the graph of a circle at radius 1. |
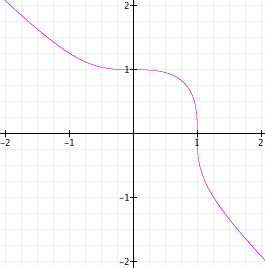
Now, lets look at what happens when we change n=3. The equation still passes through (1,0) and (0,1), but unlike when n=2, it does not form a circle. |
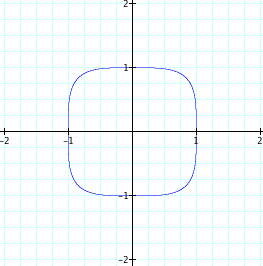
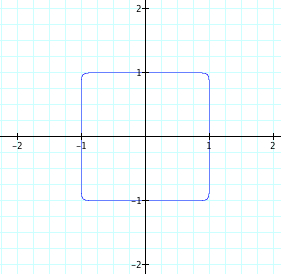
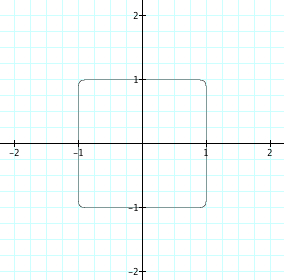
Now, let n=4. Interestingly, we see graph that look more like a square, with rounded edges. However, again centered about the origin with a radius of 1. |
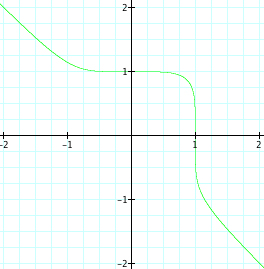
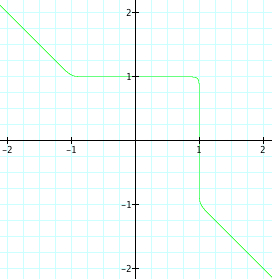
Now, lets see what the graph looks like when n=5. Again, we see a graph with a curve passing through (1,0) and (0,1). It may |
 |
|||
 |
 |
 |
 |
 |
|||
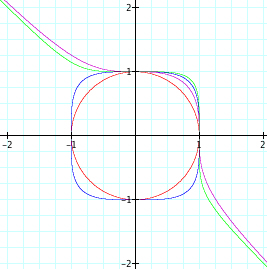
It seems we are beginning to see a pattern. We start with n=2 and see that we have a circle with radius 1. As n increases, the curve begins to look more like the corner of a square. Also, we see that when n is even the graph starts as a circle and as n increases, the graph begins to look more like a square. However, it seems that no matter the value of n, when n is even the graph of the function still passes through (1,0), (0,1), (-1,0), and (0,-1). When n is odd, the graph of the function has a slight curve in it and as n increases the curve begins to look like the corner of a square. Yet, no matter the value of n, when n is odd the graph of the function passes through (1,0) and (0,1). Taking these observations into consideration, let's continue our exploration at n=10 and n=11.
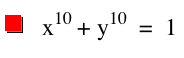
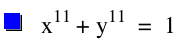
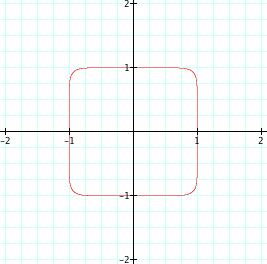
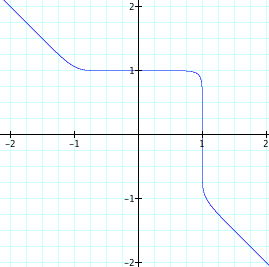
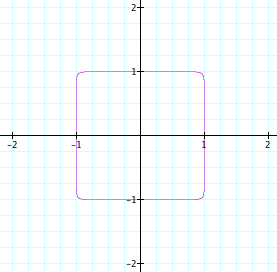
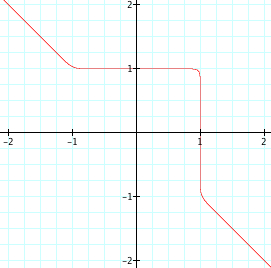
| Below is the graph of the function when n=10. Again, 10 being even, we expect more of a square shape. When we graph this function we see our assumption to be true. We see even a more squared off shape, with each of the corners appearing to be sharper than when n=2 or n=4. Also, we see that the graph still passes through (1,0), (0,1), (-1,0), and (0,-1). | Now, when n=11, we are hoping again that we get a graph of a function when a curve, as we have seen when we have odd numbers for values of n. Again, our assumption is true. The graph passes through (1,0) and (0,1). Also, we see the curve is not as rounded as it was when n=3 or n=5, but it is becoming more squared off. |
 |
 |
 |
 |
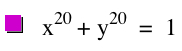
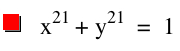
Since our assumptions continue to be true, it is reasonable to assume that when exploring with higher values of n, that even values of n will begin to look more like a square and the graph will pass through (1,0), (0,1), (-1,0), and (0,-1). Also, we assume that for odd values of n, that as n increases the graph of the function will still have a curve, yet the curve will become more and more like the corner of a square and the graphs will pass through(1,0) and (0,1). Let's look at when n increases from 20 to 25.
 |
 |
 |
 |
 |
 |
 |
 |
|
 |
 |
 |
We see that are assumptions continue to be correct. This leads us to wonder what will happen if we change the function slightly?
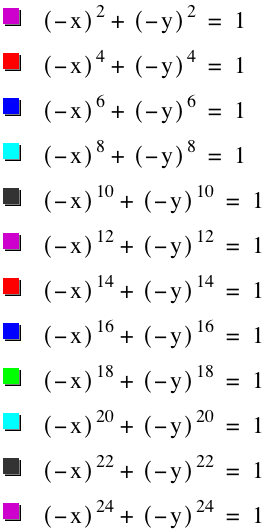
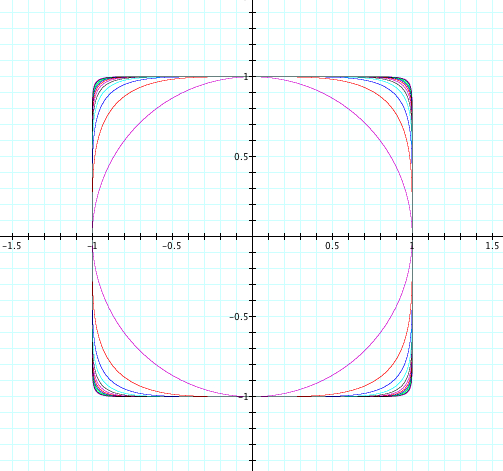
Let's graph the function when x and y is negative. Since we have discovered a difference for when n is even and n is odd, let's just look at the even values of n from 2 to 24. Usually, when you begin to look at the negative, you see some sort of reflection. Since we are making both x and y negative values, it seems that the even graph would stay the same, since it is circular. We assume that the graph of the function would be a reflection over the x/y axis. Below you see that those results seem to be accurate. The graphs of the functions look the same as when x and y were positive. When n=2, we still have the equation of a circle. The graphs of the functions start as a circle and as the even values of n increase, the graphs begin to look more like a square. Each graph still passes through (1,0), (0,1), (-1,0), and (0,-1).
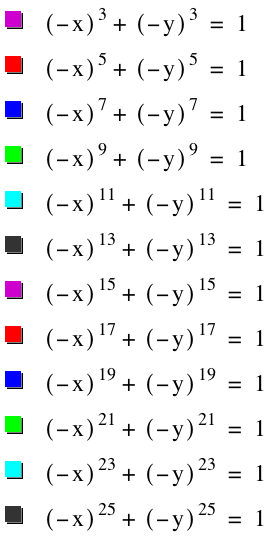
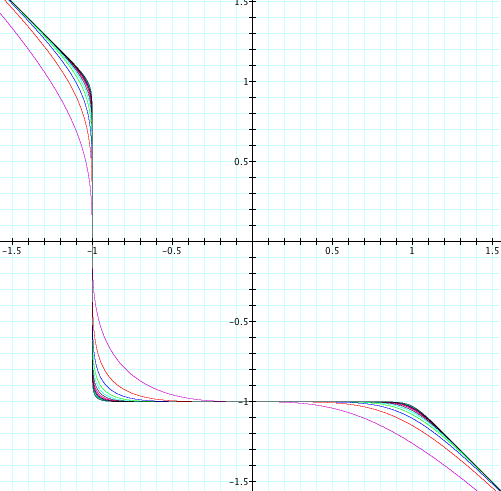
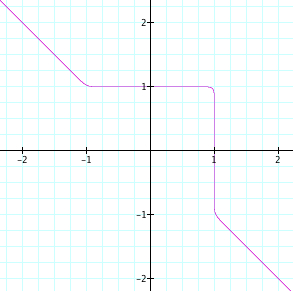
Similarly, lets look at n when the values are odd. Again, we assume that the graph will be reflected over the x/y axis. We can see clearly that our assumption is true. The curve of the graphs that we noticed when x and y were positive is now in quadrant III instead of quadrant I. Since this is a reflection, the graphs of each function pass through (-1,0) and (0,-1). As the odd values of n increases, the curve becomes less and less round and more like the corner of a square.
When exploring graphs, we can see that the slightest change to an equation can cause a major change with how the graph of the function appears. It is important the encourage our students to understand that these changes aren't random coincidences, but to help them understand how these changes affect the graphs of functions mathematically.
A further exploration could be to see the affects of when n is negative.