Kate Berryman
cavaleri@uga.edu
*Please make sure your browser is maxiumized to view this write up;
To begin this write up, it may be benifitial to talk a little bit about what the Polar coordinate system actually is. The Polar coordinate system is a two demensional coordinate system. Polar equations are often used for graphing periodic functions. In the Polar coordinate system, there is a fixed point called the pole and a ray, from this point called the polar axis. Any point P on the plane can be found using an angle, θ, and a distance, r, measured from the pole to the point P. The Polar coordinates are often written as an ordered pair, (r,θ).

It is also interesting to notice the relationship between the Polar coordinate system and the Cartesian coordinate system. In the figure below, you can see that (r, θ) in the Polar coordinate system is equal to (x,y) in the Cartesian coordinate system.

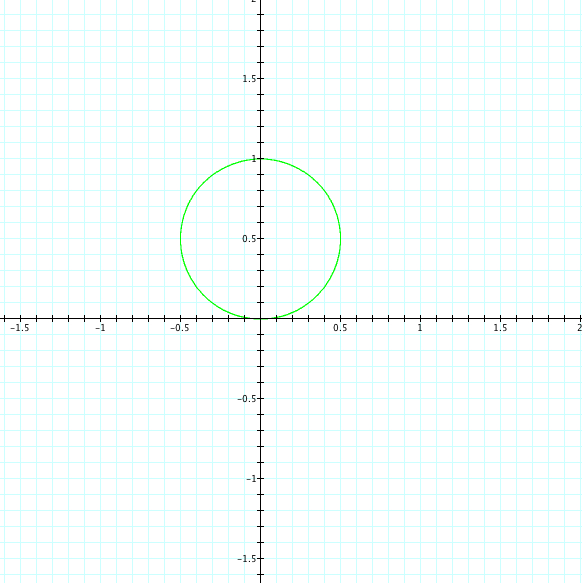
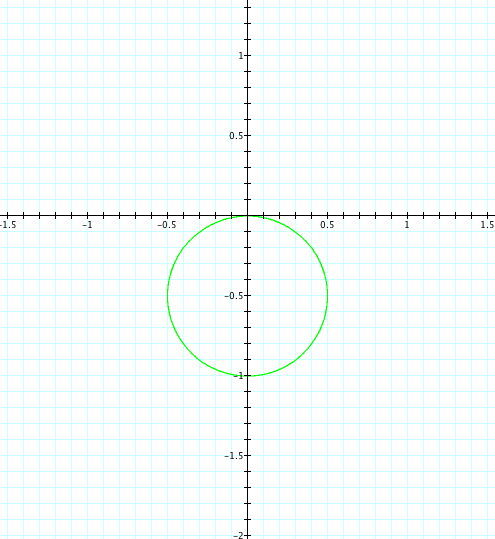
To begin our exploration, let start with simply when:
![]()
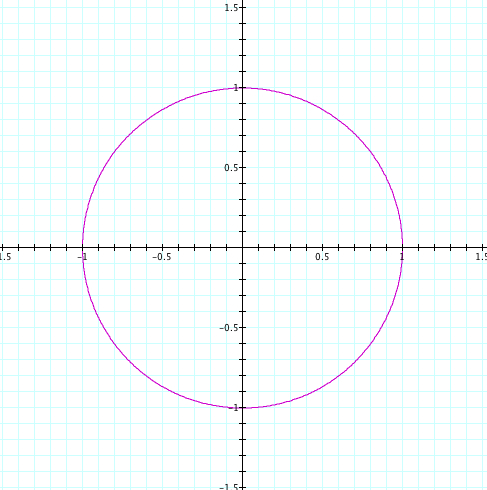
In the polar coordinate system we just have a circle with radius of 1. Now let's look at some more interesting graphs.
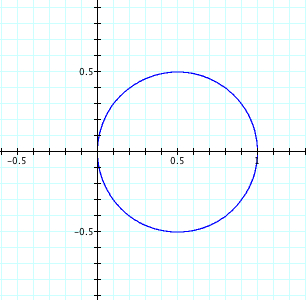
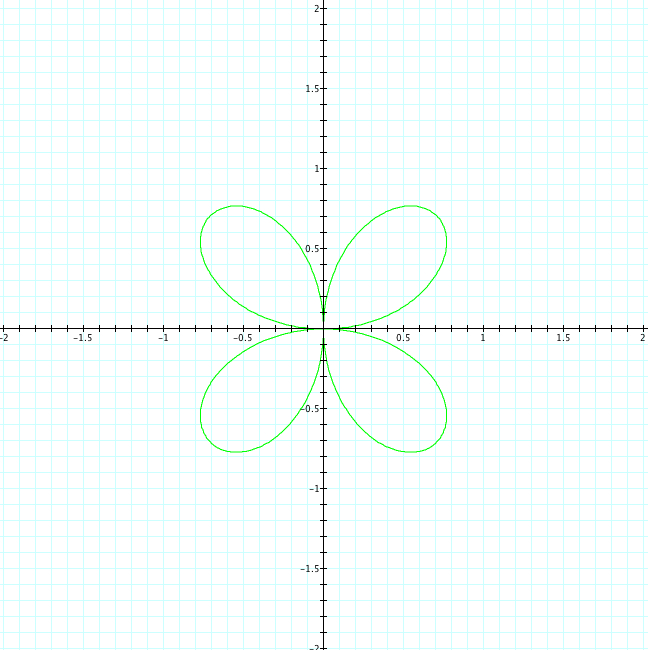
Let's begin to introduce sin and cosine. Consider the following equations and their graphs.
However, we are begining to notice that the variable a has been affected by sin and cosine. In our first picture, where r=b, we just had the unit circle. Now, we see that when we use sin and cosine, we start seeing loops.
|
|
 |
 |
 |
| b=1, k=1,-1 | b=1, k=2,-2 | b=1, k=3,-3 | b=1, k=4,-4 | b=1, k=5,-5 |
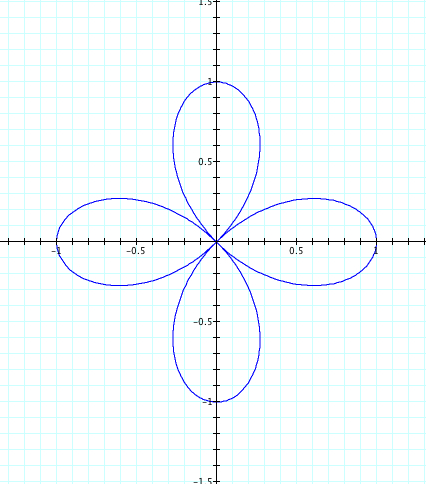
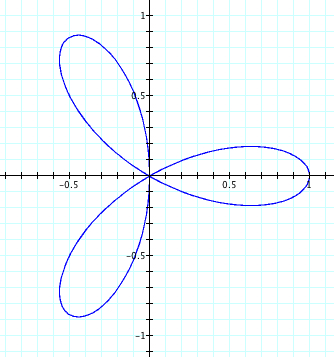
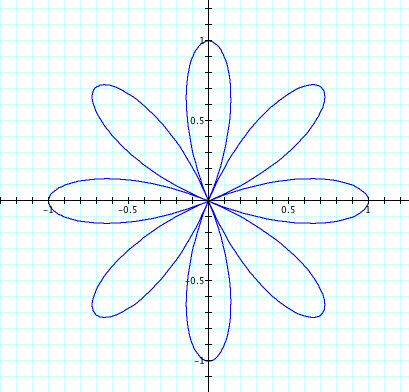
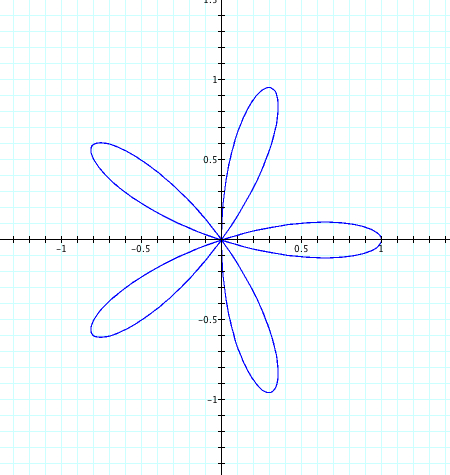
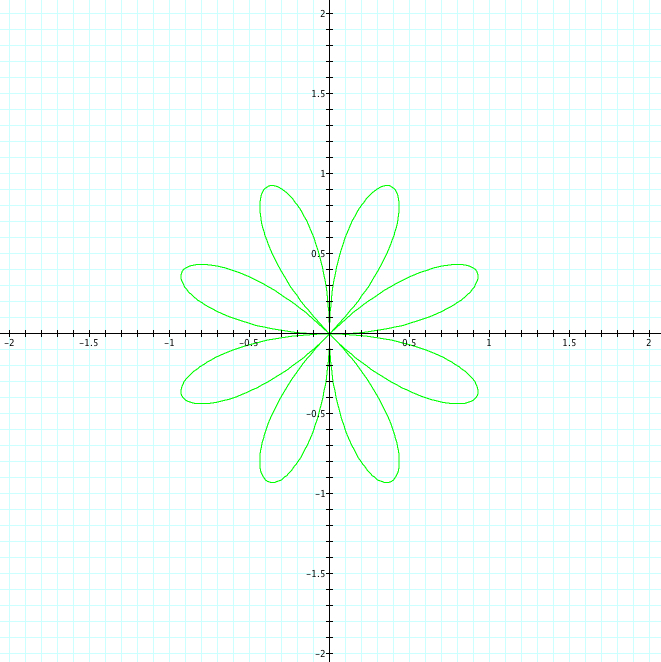
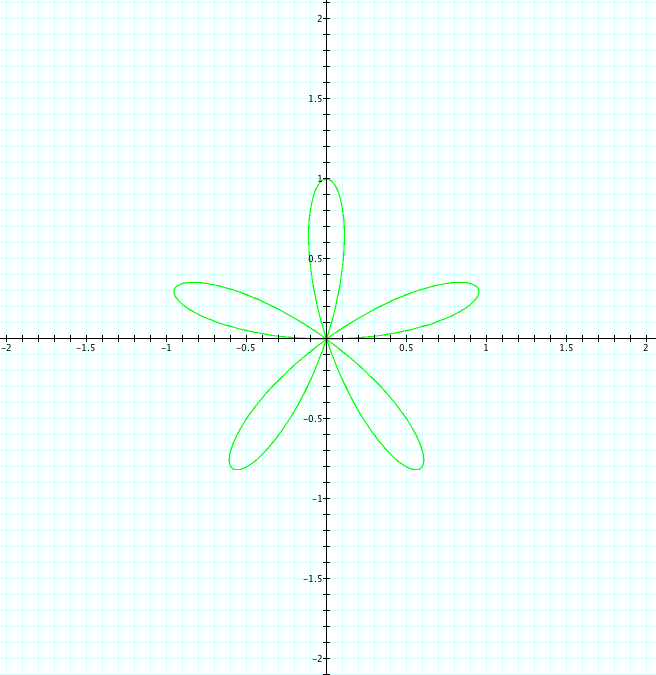
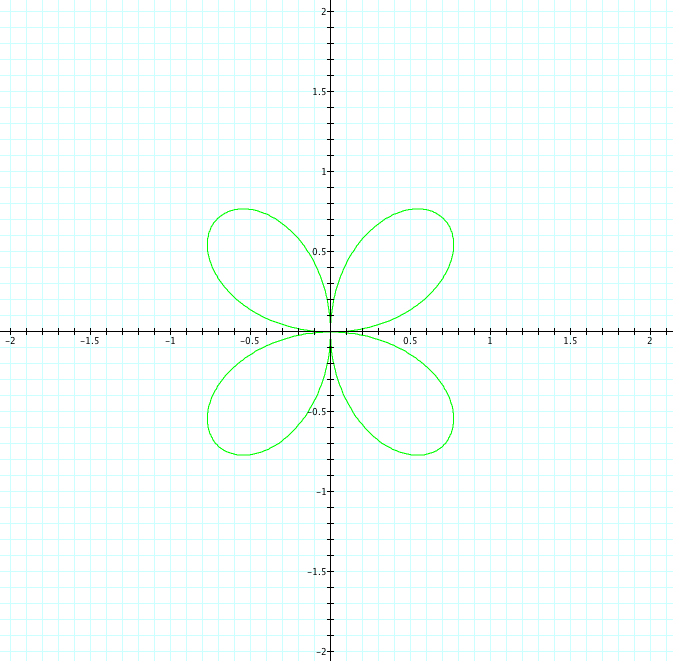
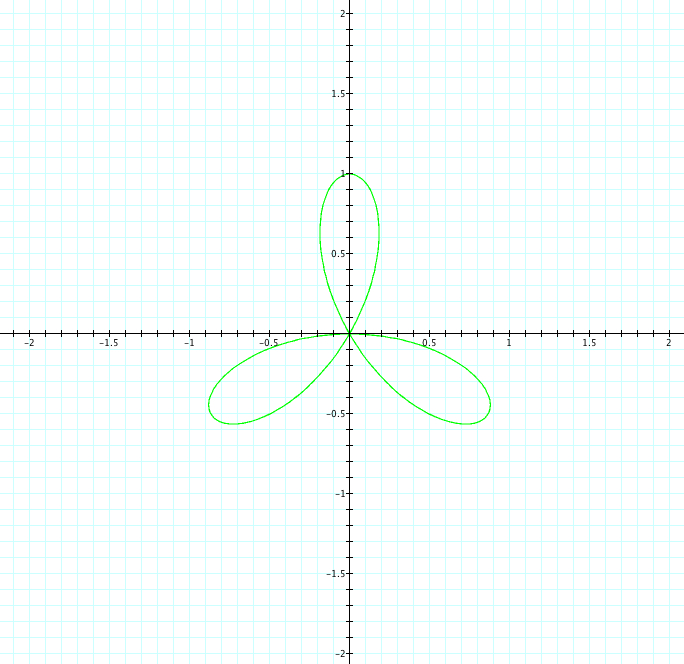
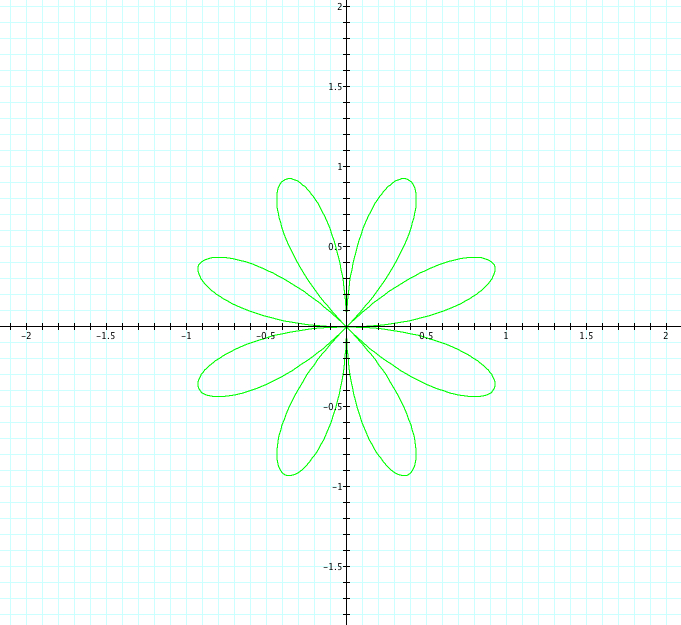
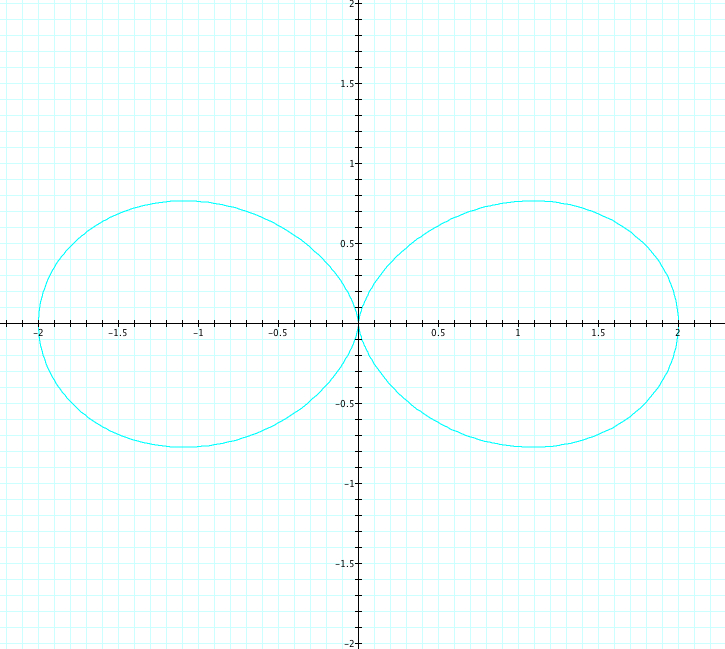
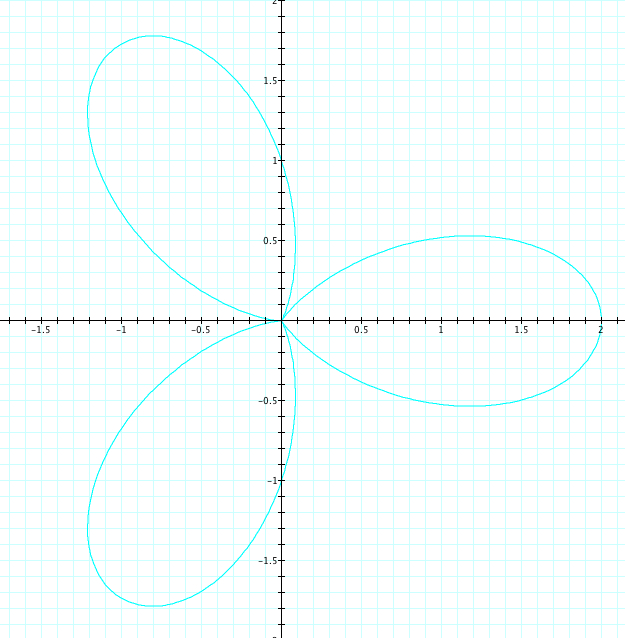
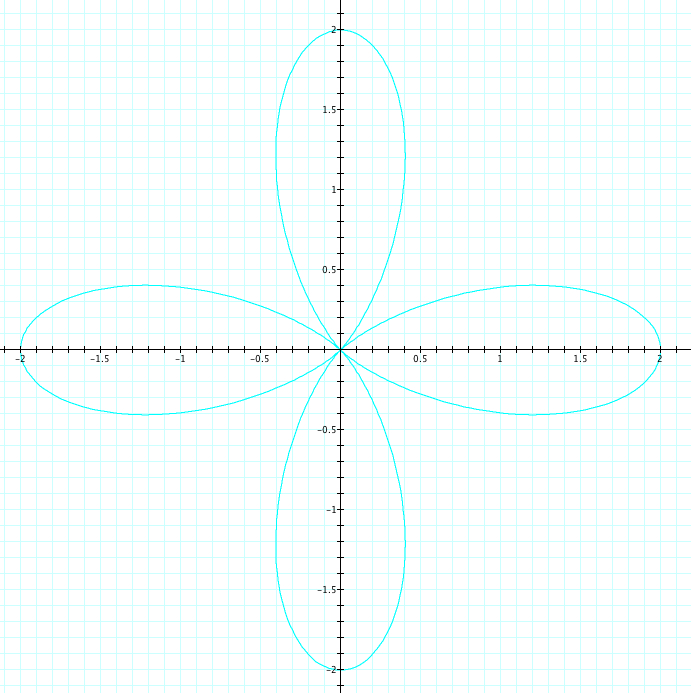
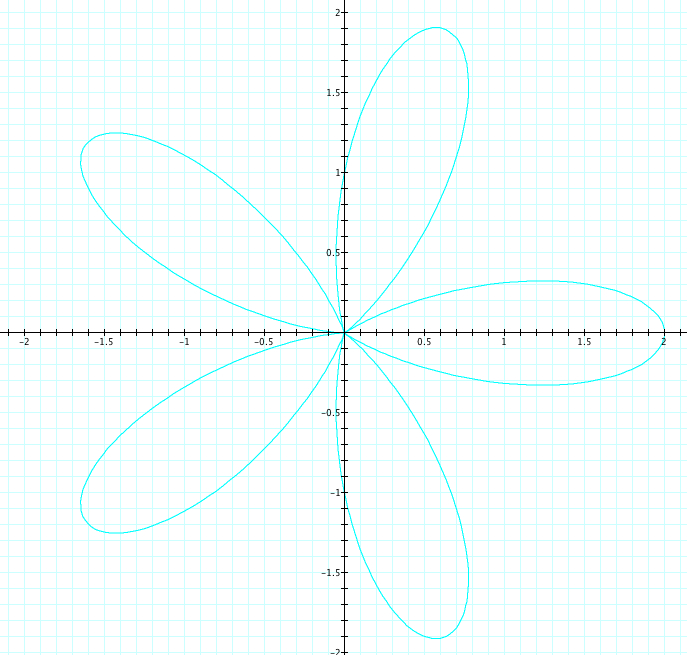
Here we are being introduced to the "n leaf rose". As the value of k changes, our graph changes signficantly. We can see that when k is even, there are an even number of petals. When k is odd, there are an odd number of petals. However, it is important to notice that when k is even, the number of petals = 2k. Whereas, when k is odd, the number of petals = k. Also, we can observe that the petals are all of length 1, which is equal to our value to b. Now, let's use sin and see what happens.
 |
 |
 |
 |
 |
| b=1, k=1 | b=1, k=2 | b=1, k=3 | b=1, k=4 | b=1, k=5 |
 |
 |
 |
 |
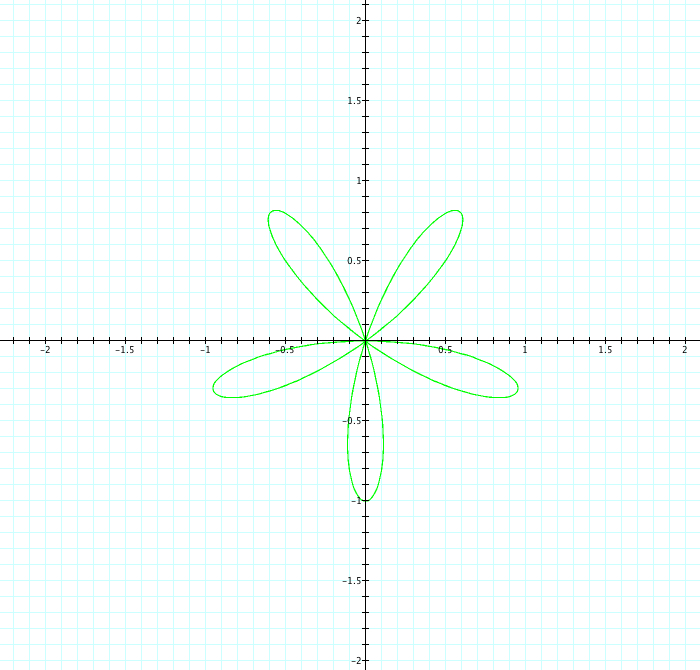 |
| b=1, k=-1 | b=1, k=-2 | b=1, k=-3 | b=1, k=-4 | b=1, k=-5 |
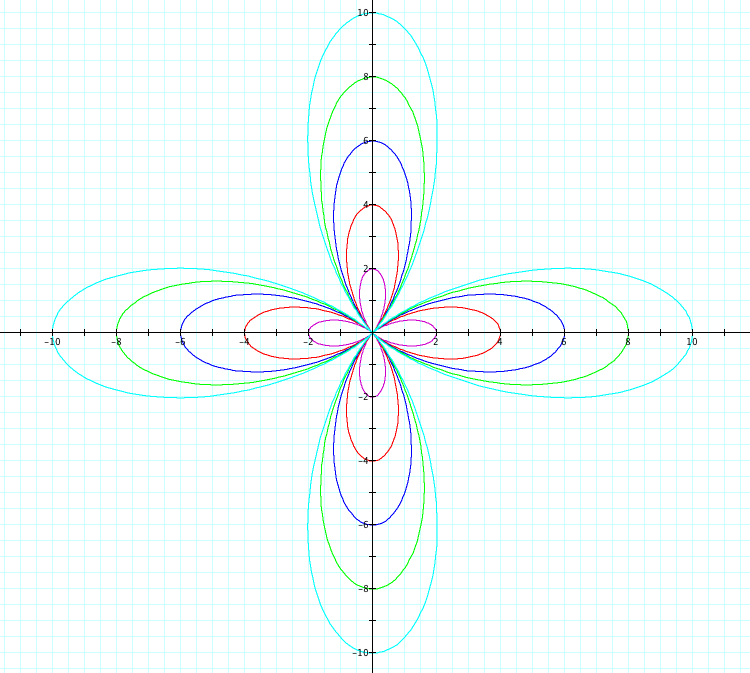
Using sin, we see that for negative values of k, the graph is reflected over the x axis. Again we have the number of petals is equal to k when k is odd and twice the number of petals are seen when k is even. Also, the petal length remains at 1, our value of b. Let's explore further and see what happens when we introduce a.
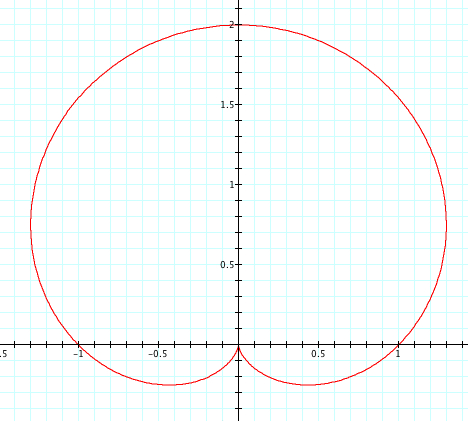
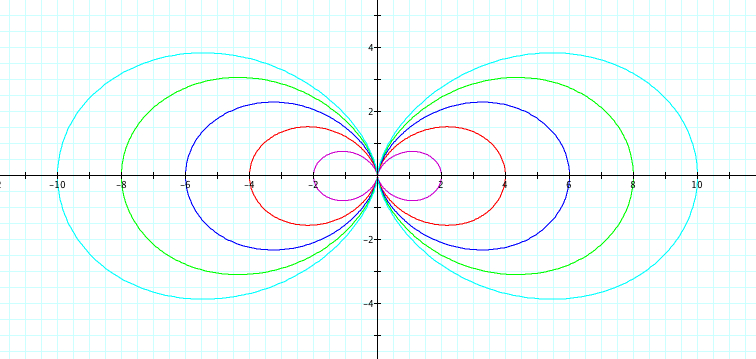
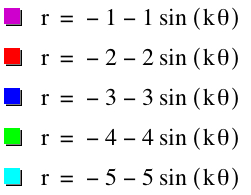
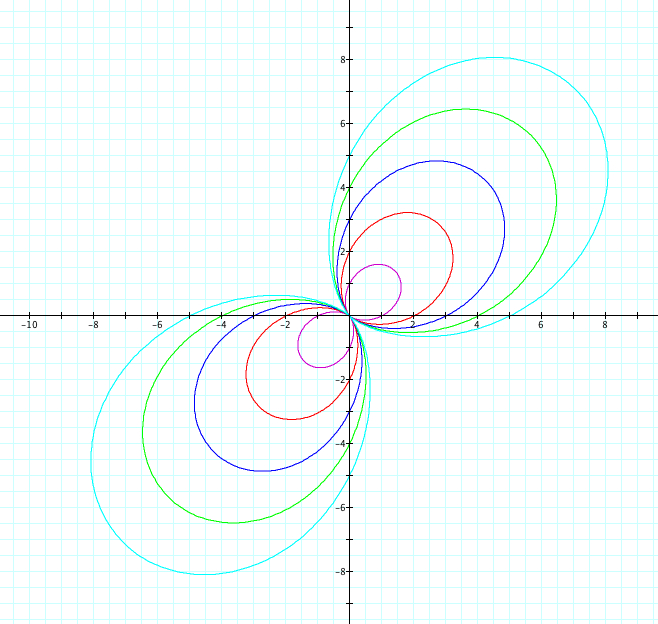
Now, let's explore when a=b and k is varied. We will let a=b=1 and k will vary from -5 to 5. Observe the graph below
 |
 |
 |
 |
 |
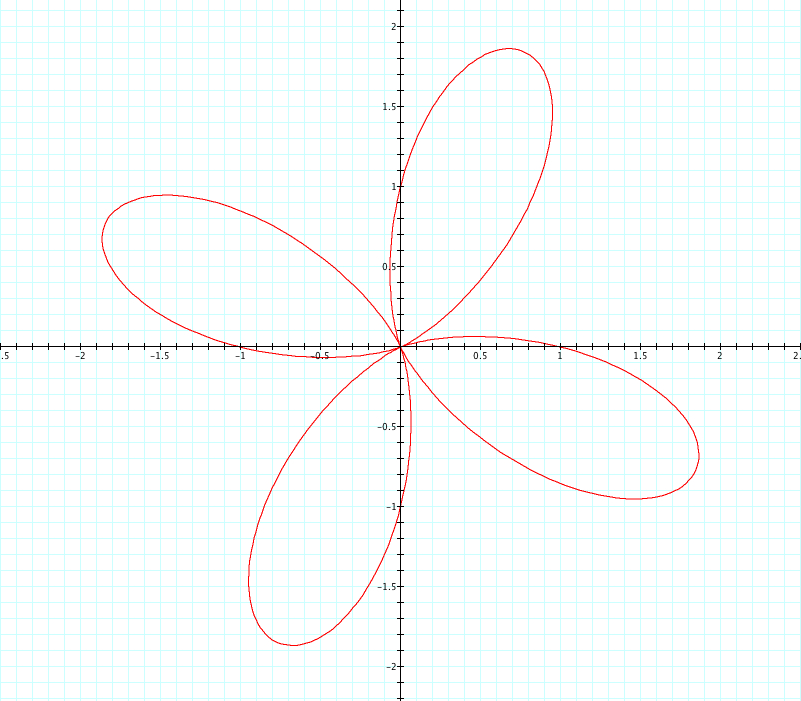
| a=1, b=1, k=-1, 1 | a=1, b=1, k=-2, 2 | a=1, b=1, k=-3, 3 | a=1, b=1, k=-4, 4 | a=1, b=1, k=-5, 5 |
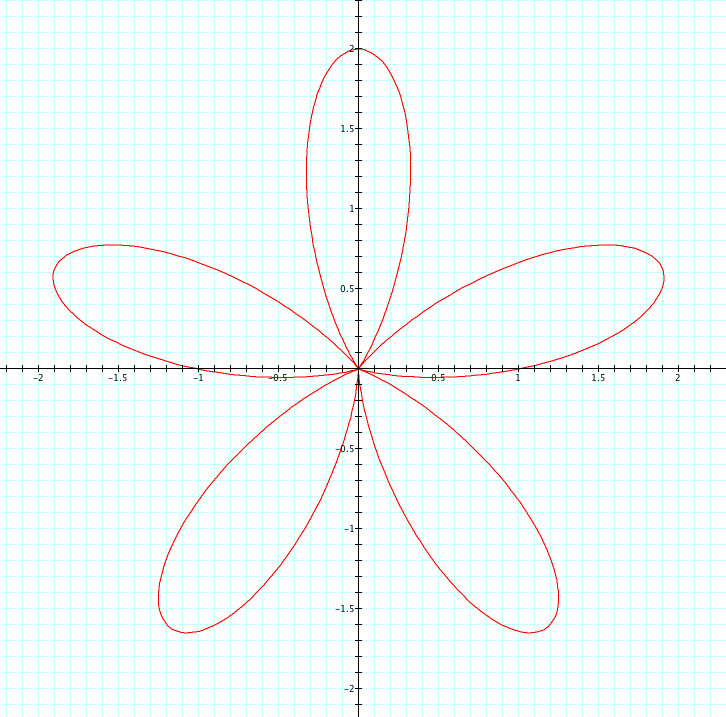
As we saw in our first exploration, the graphs where a number k is positive, are the same as when that number k is negative. We can see that the number of petals is again equal to |k|. Let's look closely at the length of the petals. The are all of length 2, which, again is confirmation that a+b=length of the petal.
Take a closer look at when k is odd. We can easily see that the petal length is 2 where it crosses the x axis. Let's look closer at where it crosses the y axis. For each odd value of k, the petal crosses at a length of 1, which are our values of a and b. We also want to notice that the petals start at our orgin. While a+b is our petal length, could a-b be where the indention of the petal crosses the axis? We will come back to the in Exploration #3.
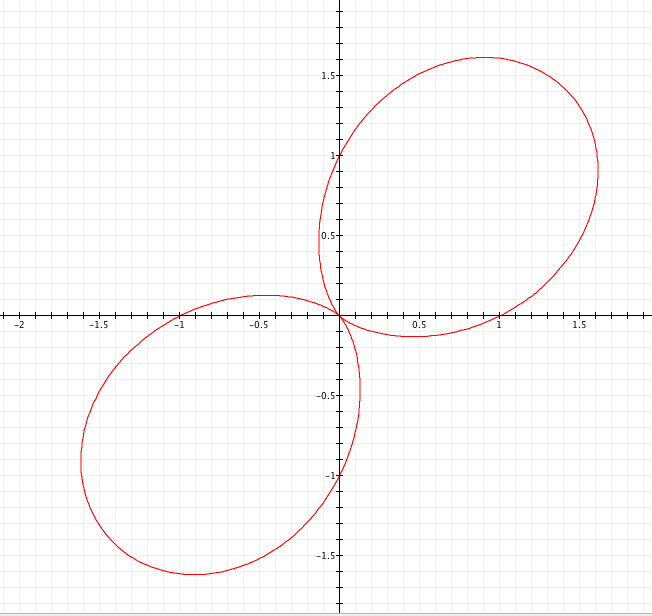
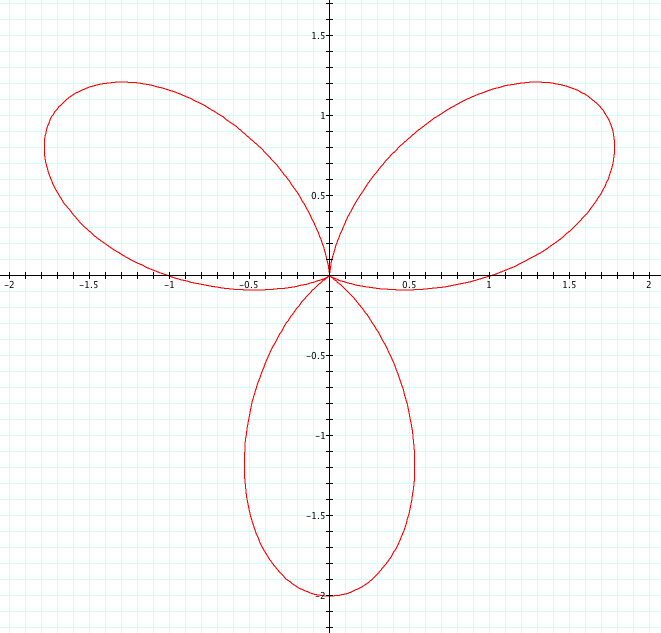
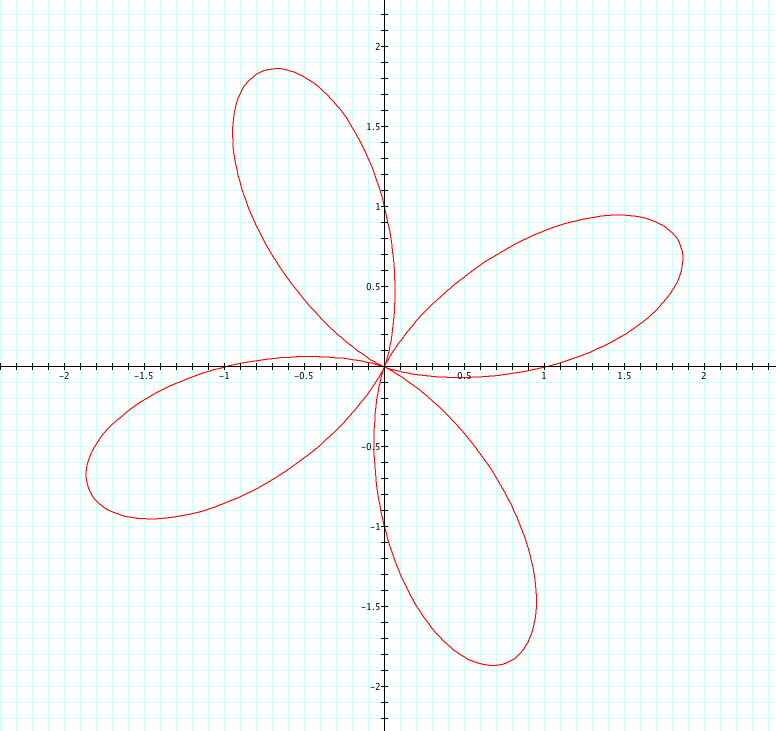
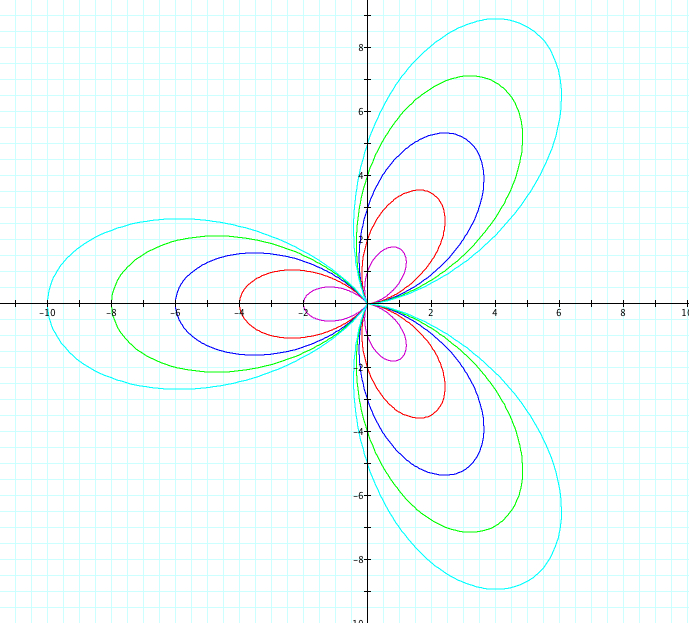
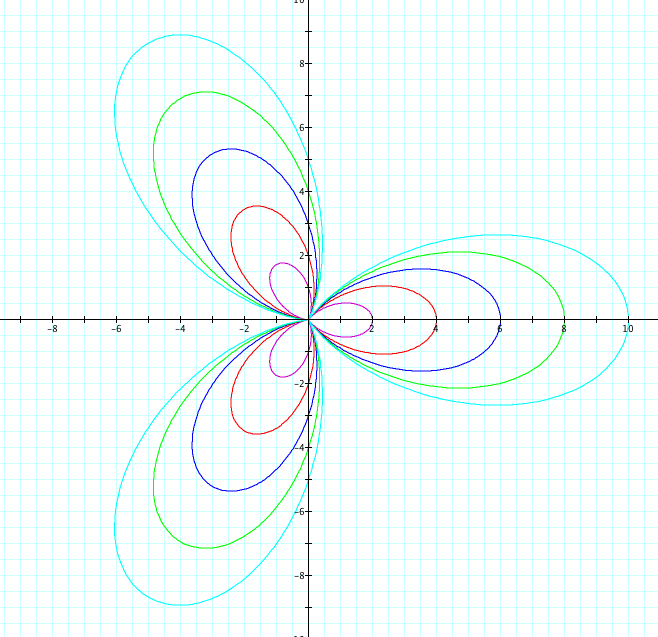
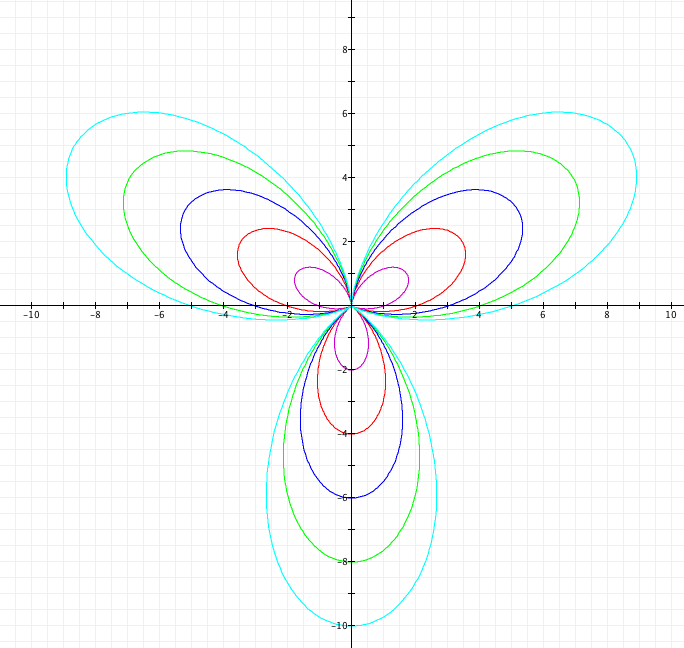
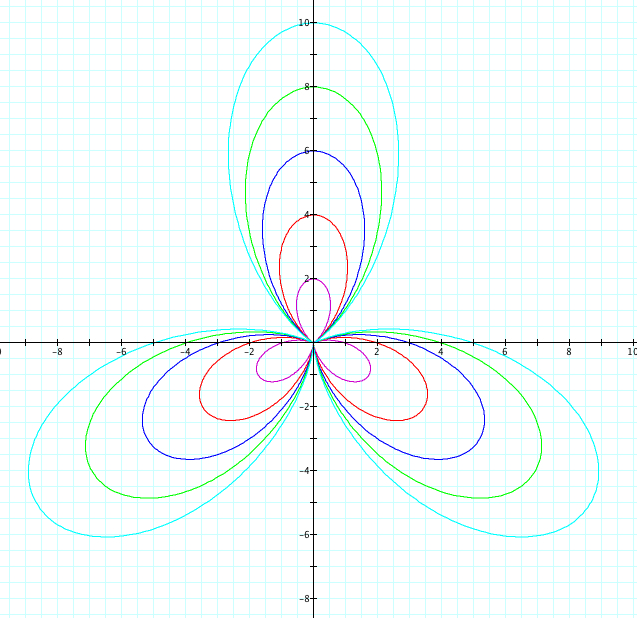
Let's look at our same equation, where a=1, b=1, and k is varied from -5 to 5 and see what happens when we replace sin with cosine.
 |
 |
 |
 |
 |
| a=1, b=1, k=1 | a=1, b=1, k=2 | a=1, b=1, k=3 | a=1, b=1, k=4 | a=1, b=1, k=5 |
 |
 |
 |
 |
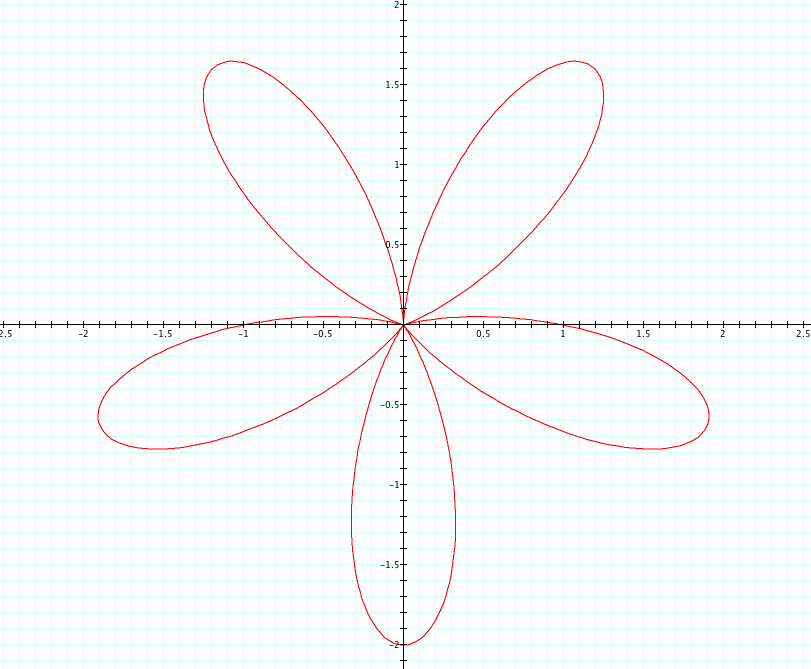 |
| a=1, b=1, k=-1 | a=1, b=1, k=-2 | a=1, b=1, k=-3 | a=1, b=1, k=-4 | a=1, b=1, k=-5 |
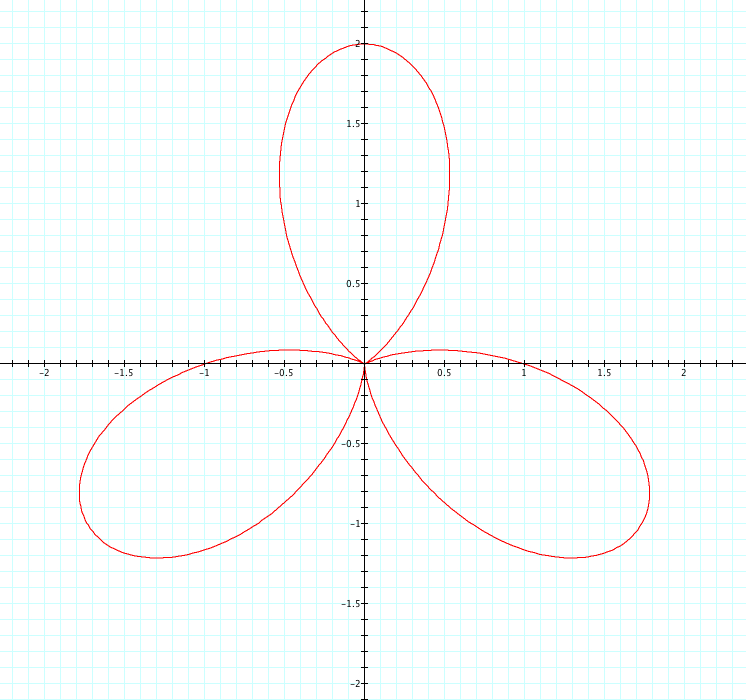
Unlike when we used cosine, we see that when k is negative it is the reflection of when k is positive. Interestingly, when k is even the reflection occurs over the y axis and when k is odd the reflection occurs over the x axis. Again, we see that k=number of petals. We see that the petals have length of a+b=2, and each graph has one or more petals that cross the x or y axis at length 1. Since a=b=1, is it a or b that affects where these petals cross the axis? This is something we will look at more in Exploration #4.
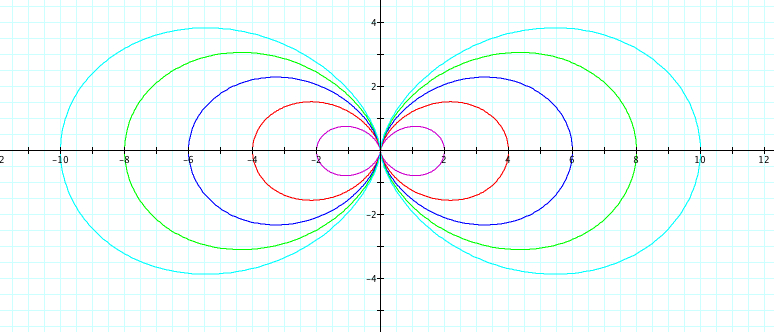
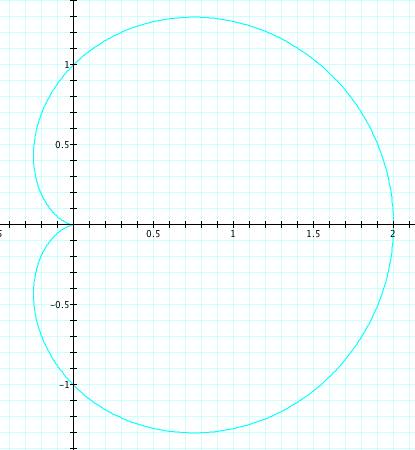
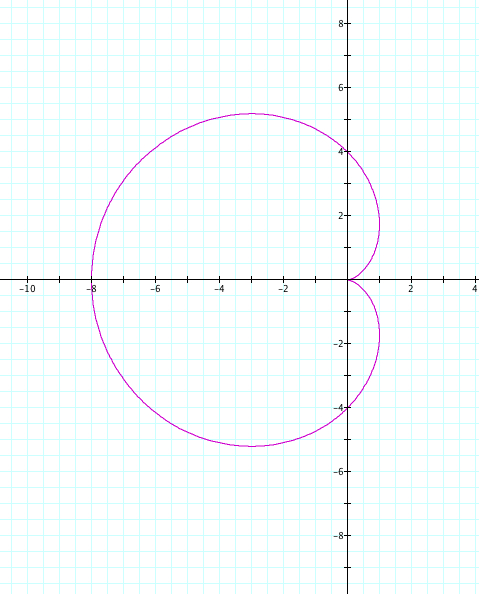
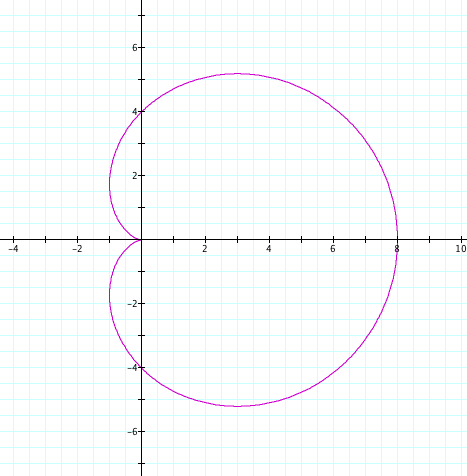
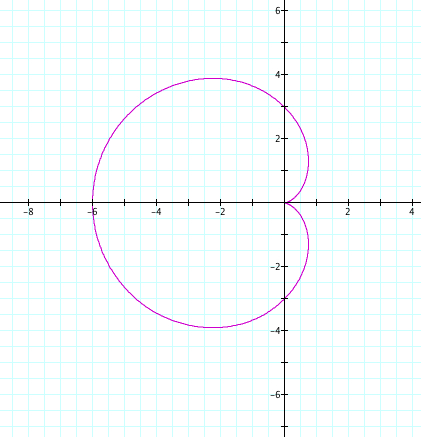
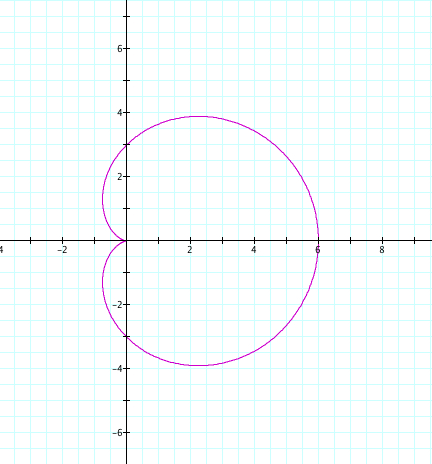
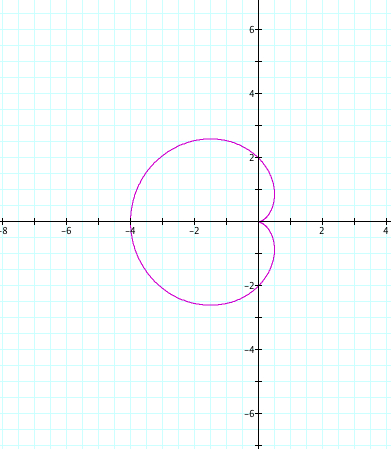
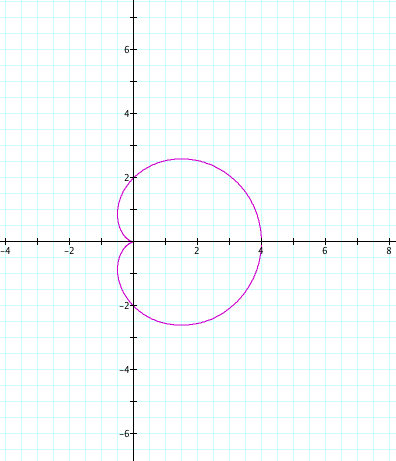
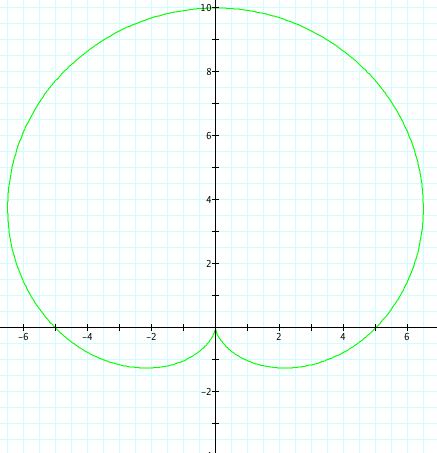
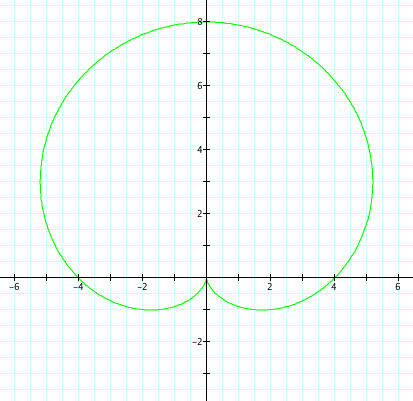
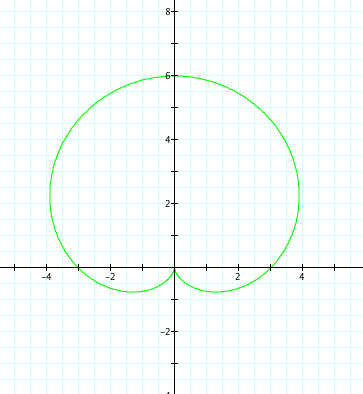
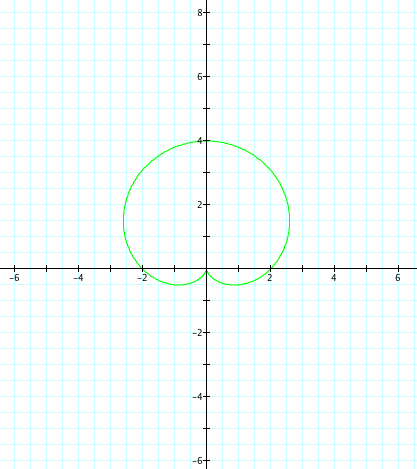
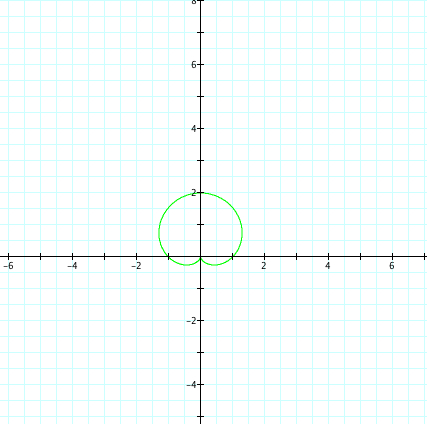
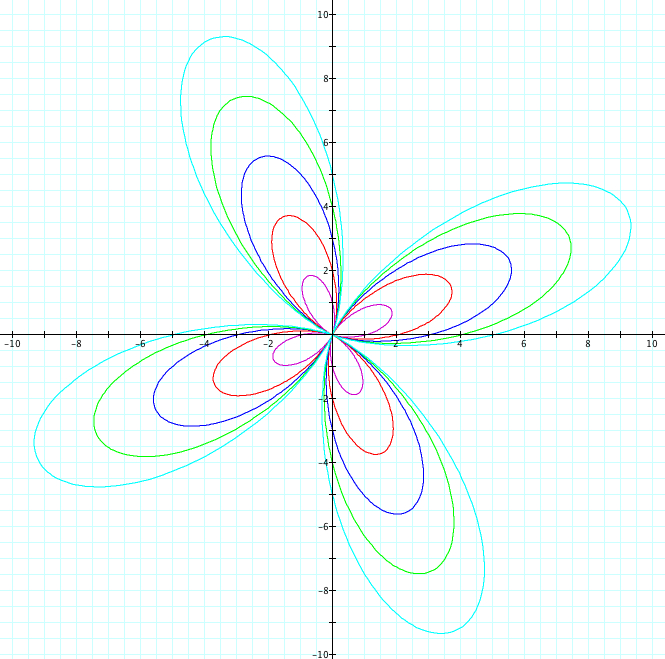
What will happen if we set our value of k, keep a=b, but vary our value of a,b? In our first example we will use cos, set k=1, and let a and b vary from -5 to 5.
 |
 |
| a=-5, b=-5, k=1 | a=5, b=5, k=1 |
 |
 |
| a=-4, b=-4, k=1 | a=4, b=4, k=1 |
 |
 |
| a=-3, b=-3, k=1 | a=3, b=3, k=1 |
 |
 |
| a=-2, b=-2, k=1 | a=2, b=2, k=1 |
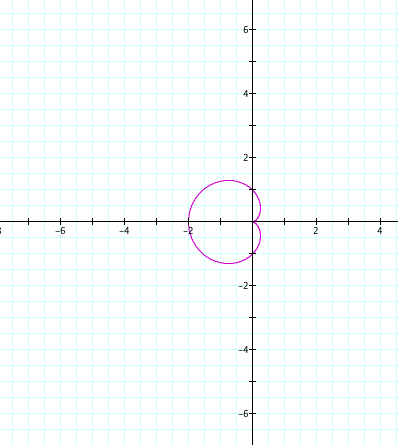 |
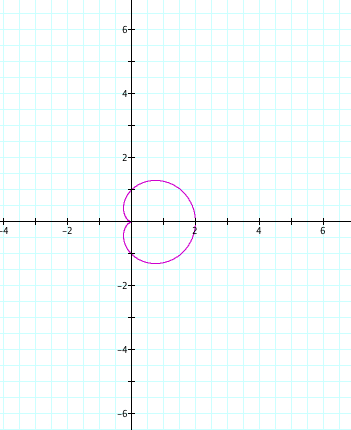 |
| a=-1, b=-1, k=1 | a=1, b=1, k=1 |
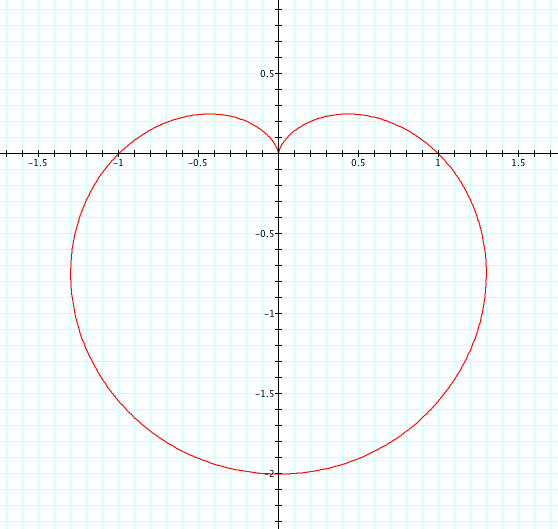
Since k=1, we only have one petal. We see that our positive and negative values of a and b cause a reflection over the y axis. Again, a+b is the length of our petal, and we observe that the petal crosses the y axis at the length of our a and b value.
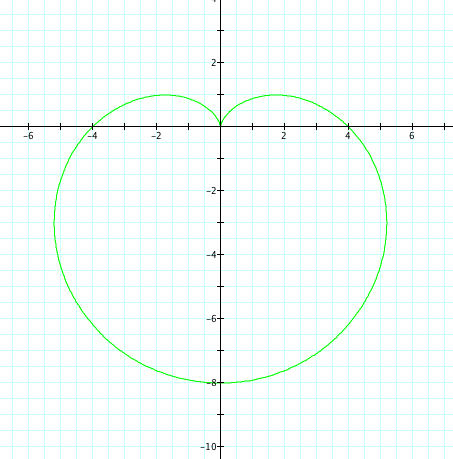
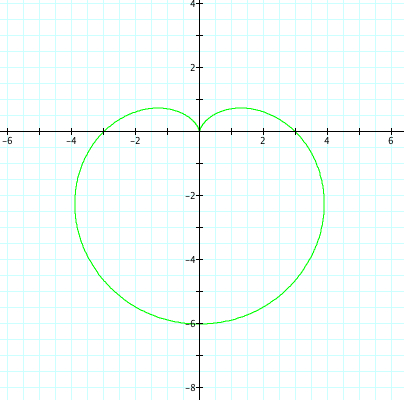
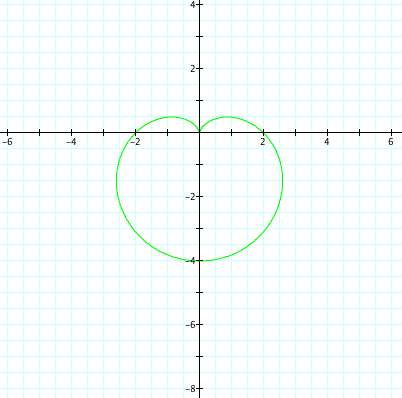
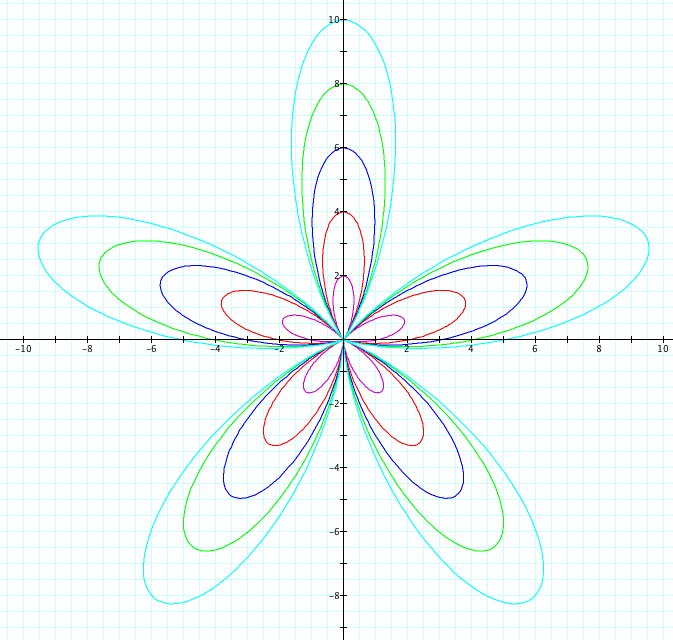
Let's replace cosine with sin.
 |
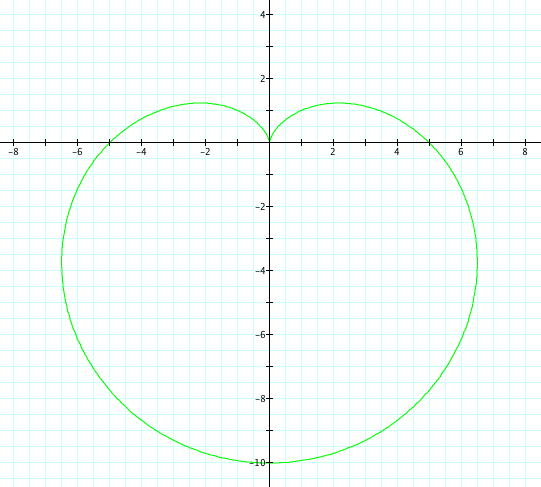 |
| a=-5, b=-5, k=1 | a=5, b=5, k=1 |
 |
 |
| a=-4, b=-4, k=1 | a=4, b=4, k=1 |
 |
 |
| a=-3, b=-3, k=1 | a=3, b=3, k=1 |
 |
 |
| a=-2, b=-2, k=1 | a=2, b=2, k=1 |
 |
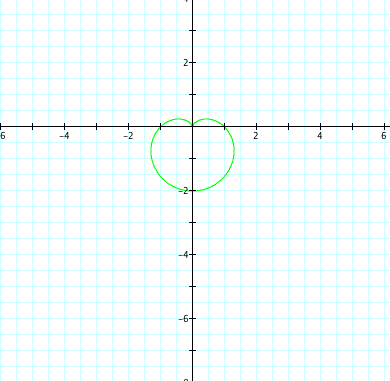 |
| a=-1, b=-1, k=1 | a=1, b=1, k=1 |
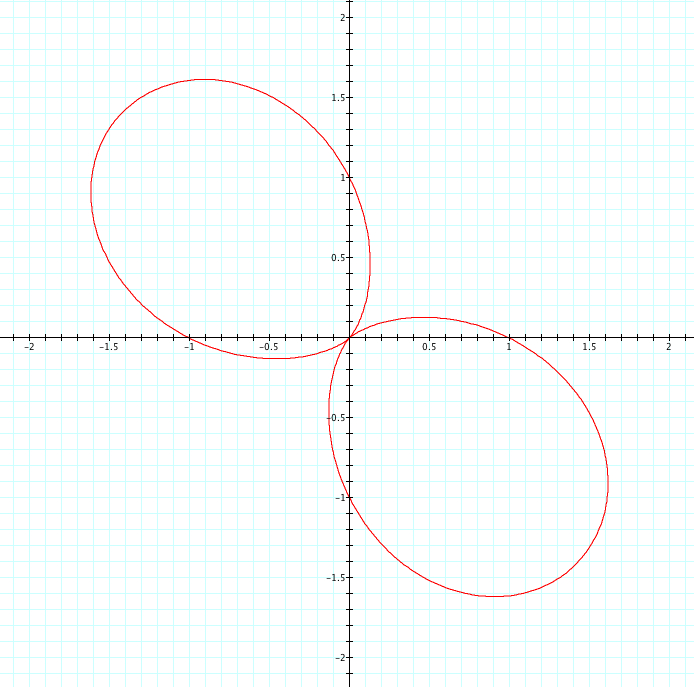
The same observations can be made, except now have refection over the x axis.
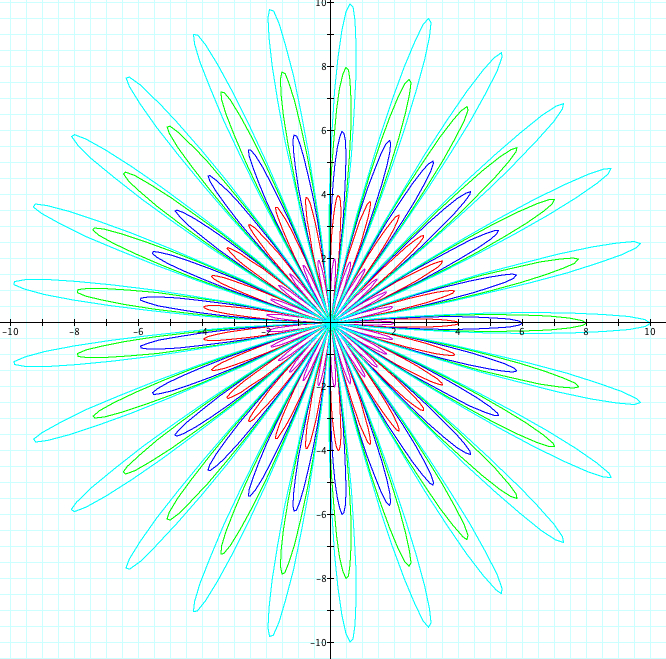
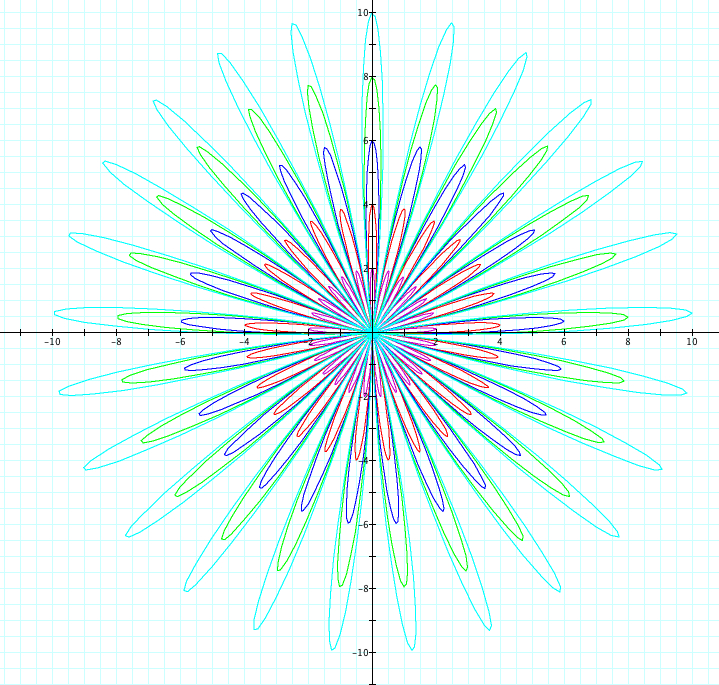
Let's look at some more interesting examples. Using cosine, we will observe when a=b from 1 to 5 and -1 to -5. Since we already saw above when k=1, we will look at cases when k=2,3,4,5 and k=-2,-3,-4,-5. Also, for fun, we have when k=25, -25.
 |
 |
| k=2 | k=-2 |
 |
|
| k=3 | k=-3 |
 |
 |
| k=4 | k=-4 |
 |
 |
| k=5 | k=-5 |
|
 |
| k=25 | k=25 |
|
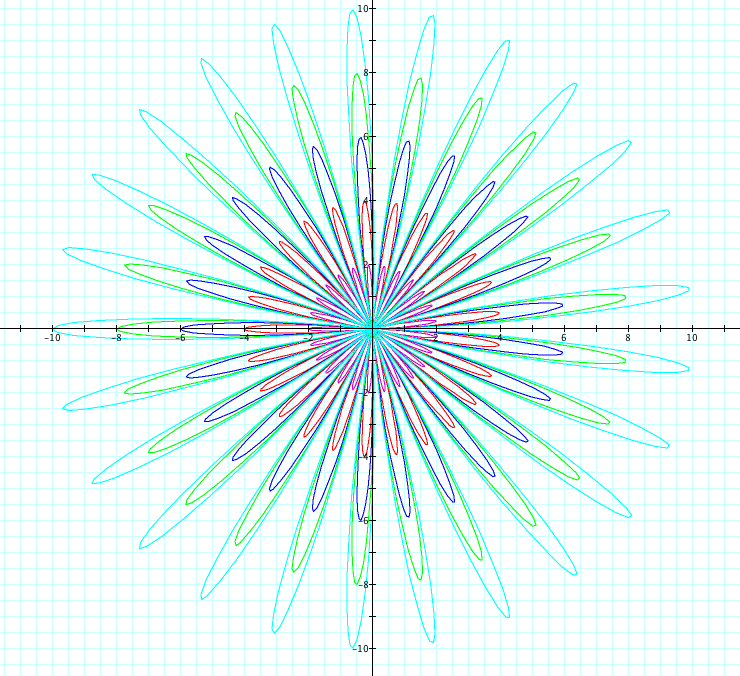 |
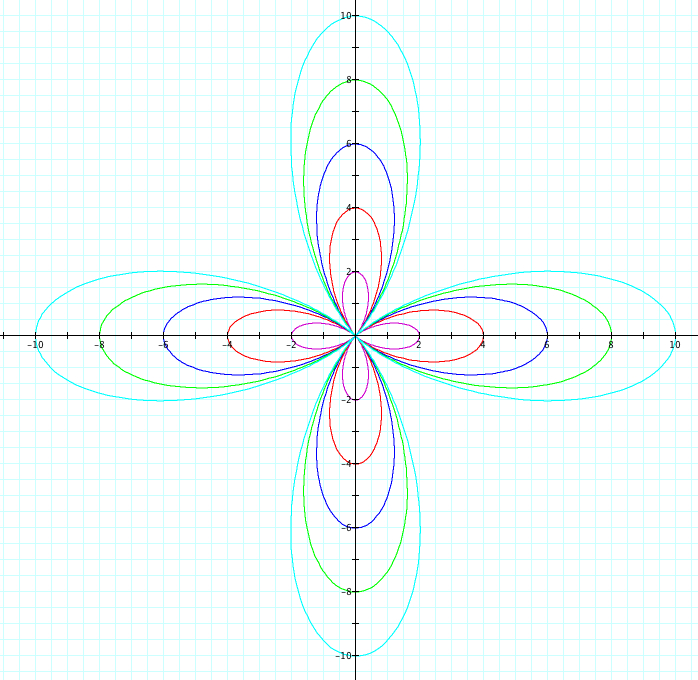
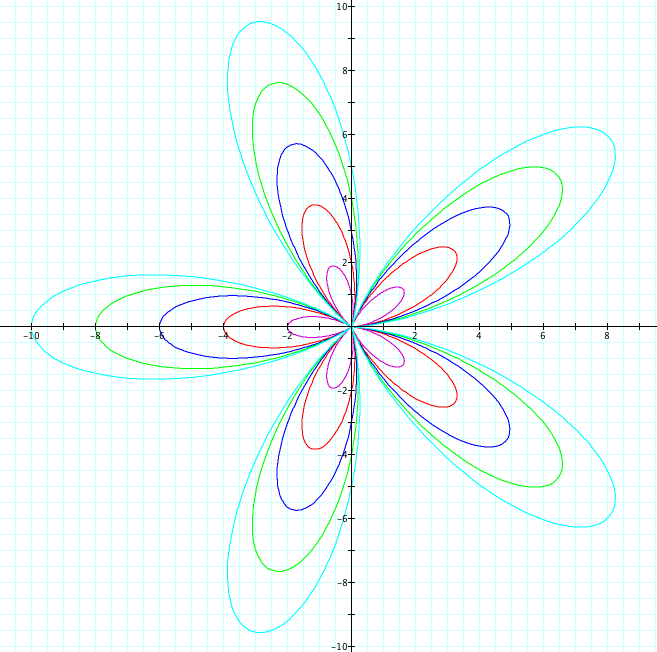
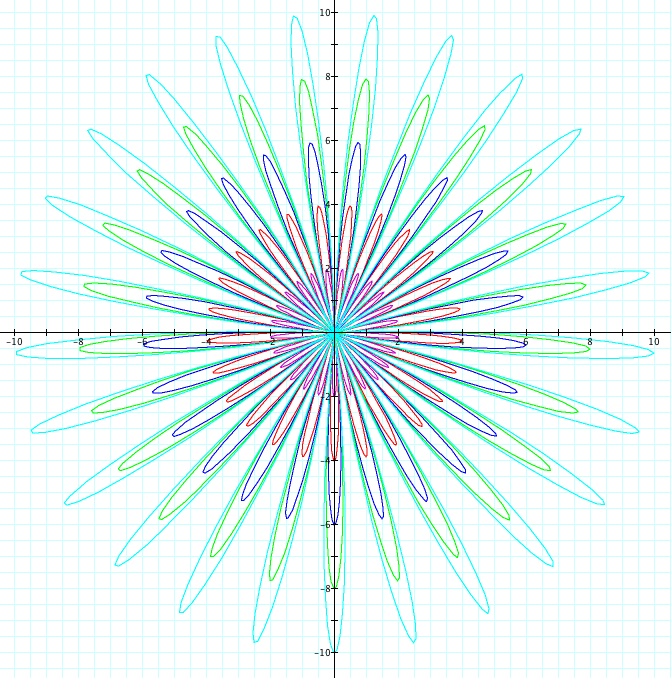
Similiarly, let's use sin. We will observe when a=b from 1 to 5 and -1 to -5. Since we already saw above when k=1, we will look at cases when k=2,3,4,5,25 and k=-2,-3,-4,-5, -25
 |
 |
| k=2 | k=-2 |
 |
|
| k=3 | k=-3 |
 |
 |
| k=4 | k=-4 |
 |
|
| k=5 | k=-5 |
 |
|
| k=25 | k=-25 |
 |
 |
So far, it seems we have found the following to be true:
1) |k|=number of petals
2) a + b = petal length
3) when k is even and r = a + b cos(kθ), the graphs of the positive and negative values of k are reflection over the y axis
4) when k is even and r = a + b cos(kθ) the graph of positive k and negative k are the same
5) when k is odd and r = a + b sin(kθ), the graphs of the positive and negative values of k are reflection over the x axis
6) when k is even and r = a + b sin(kθ, the graph of positive k and negative k are the same
7) in the graphs where petals cross an axis before reaching their maxium length, the petal cross that axis at the value of a and b
We have looked at when k is varied and when a and b are varied, but only in the case when a=b. What about when a>b or b<a? Let's take a look at this in Exploration #4.
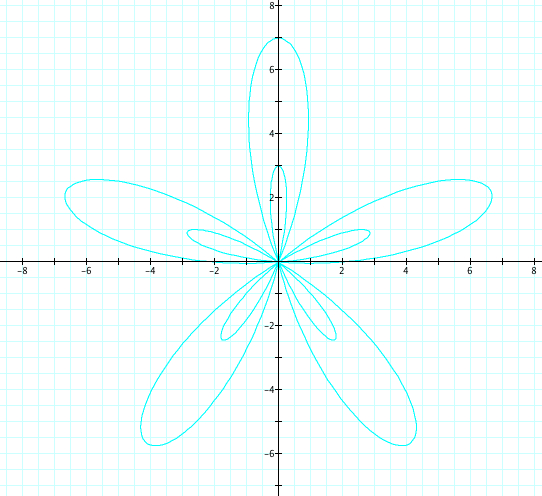
Let's start with our equation of r = a + b cos (kθ). Using the example when k=5, we will set a=5 and b to vary from 1 to 4, therefore a>b.
 |
|||
 |
 |
 |
 |
All of our previous discovers remain true. We first notice that the graph can be reflected over the x axis. Now, look closely at where the petals cross on the y axis. In Explorations 1, 2, and 3 we noticed that the petals that crossed an axis and hadn't reached their maxium length, crossed the axis at the value of a and b. However, with a=b, we could not descifer whether this was caused by the value of a or the value of b. We can see that in all four graphs, the petals that haven't reached their maximum length are crossing the y axis at length of 5, which is exactly our value of a!
We also looked at in Exploration 1, the "indent" of the petal. In our previous explorations, every petal had maximum length of k and the returned to the orgin. Now, we can see that our value of a and b affect how "tight" the petals are. In our first graph, the petals cross the y axis at our value of a+b=9 and cross at -1, which happens to be b-a. This is true for the other three graphs! So, can we conclude that the maximum length of the petal is a+b while the "indent" of the petal is b-a?
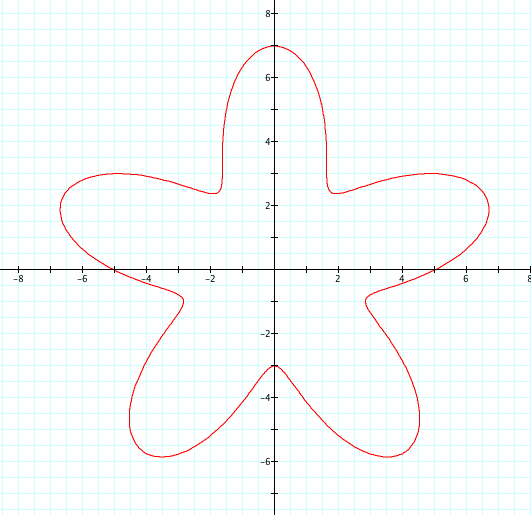
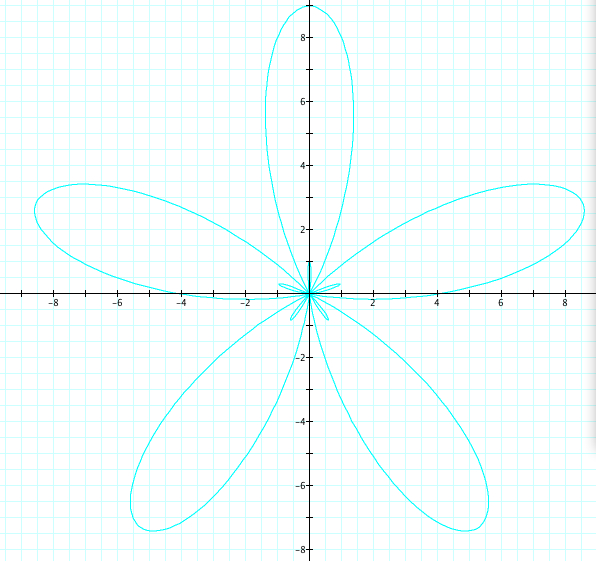
Let's look at when r = a + b sin(kθ) when k=5, we will set a=5 and b to vary from 1 to 4, therefore a>b.
 |
 |
 |
 |
We see the same shapes as when we were looking at cosine, however, these graphs can be reflected over the y axis with no change. The indent of the petal as it crosses the y axis is infact b-a and the petal crosses the x axis at the length equal to a.
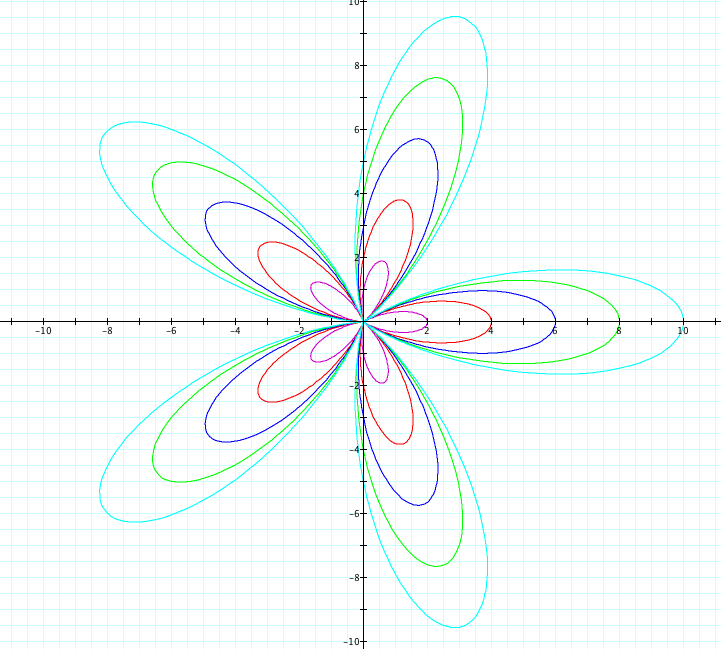
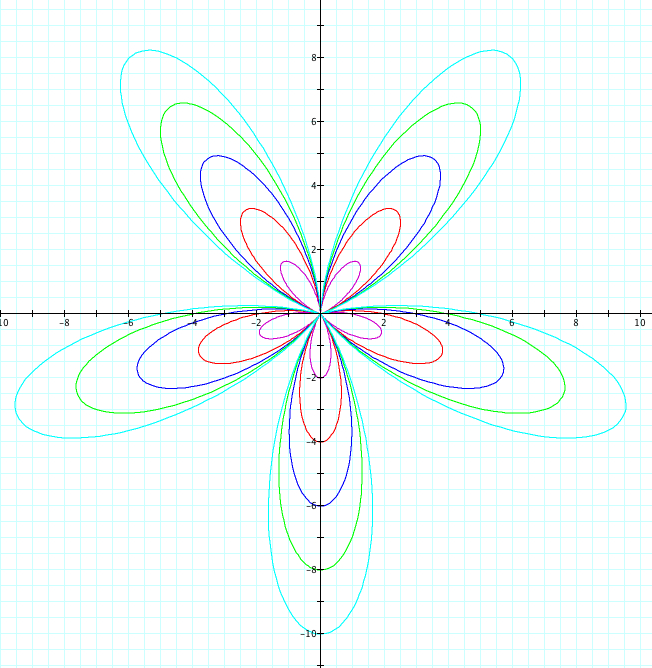
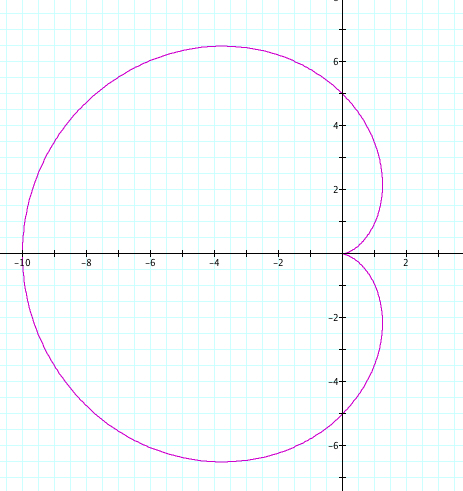
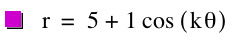
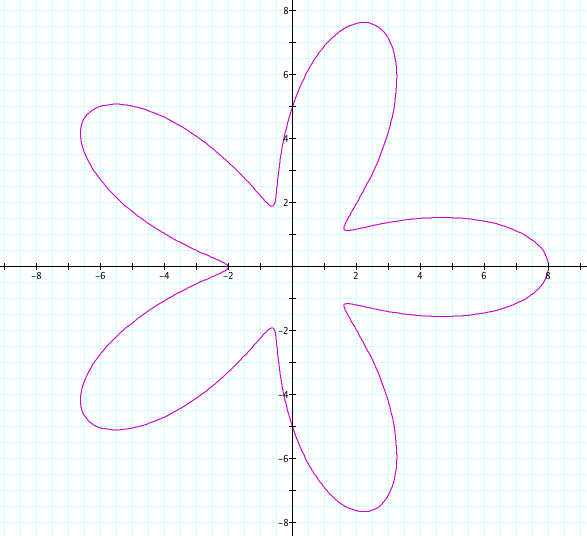
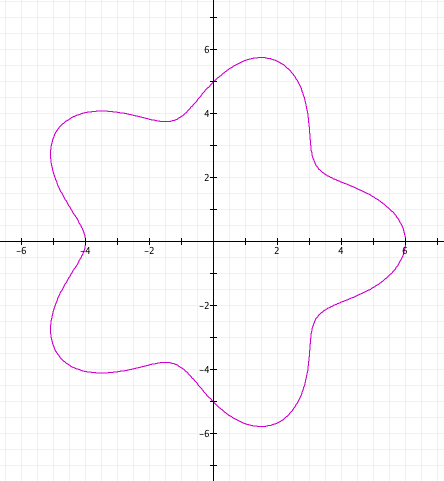
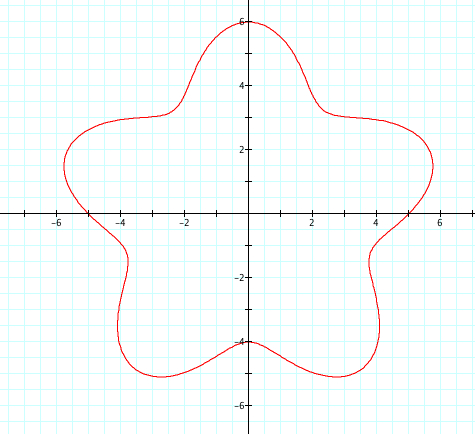
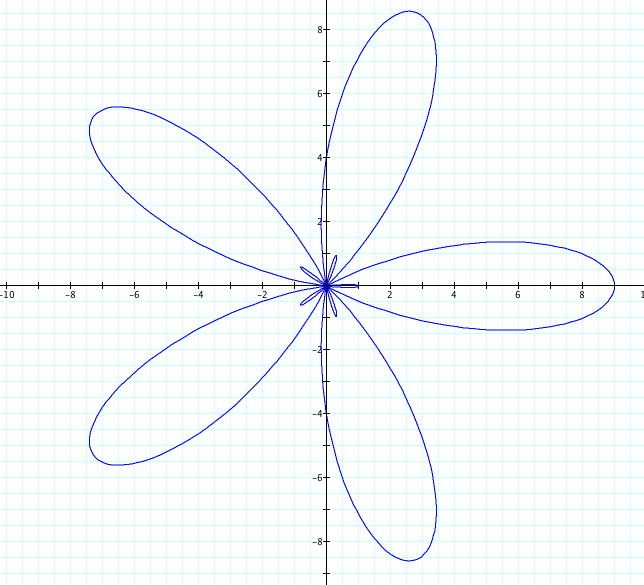
Let's look at r = a + b cos(kθ), where k=5, b=5, and a varies from 1 to 4. Therefore a<b.
 |
 |
 |
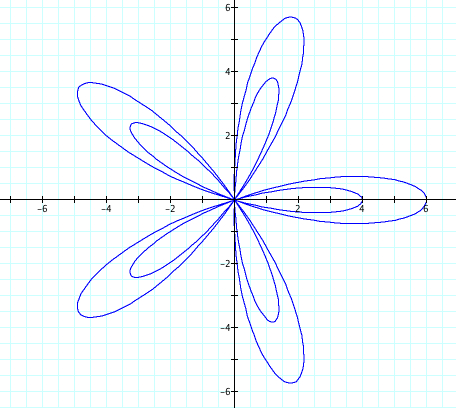 |
Interesting! We have another set of petals that has appeared. Again, these graphs can be reflected over the x axis. We see that a+b still is the length of our large petal, while our small petals have length of b-a. Intuitively, it seems that if a>b, the petals are not "tight", but as a gets closer to equally b, the indentions of the petals get closer and closer to the orgin. As a<b, these "indentions" pass through the orgin and create a new petal within the larger petals.
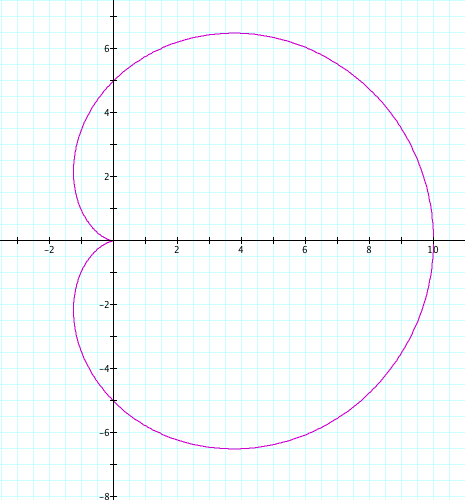
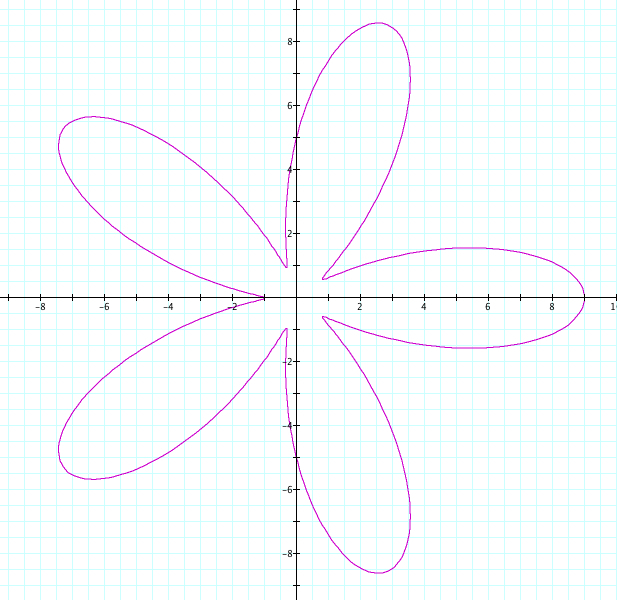
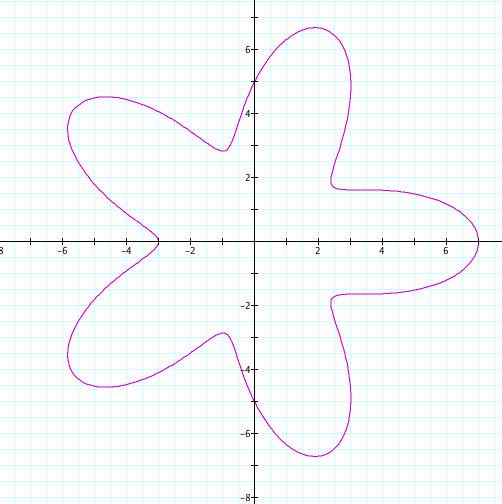
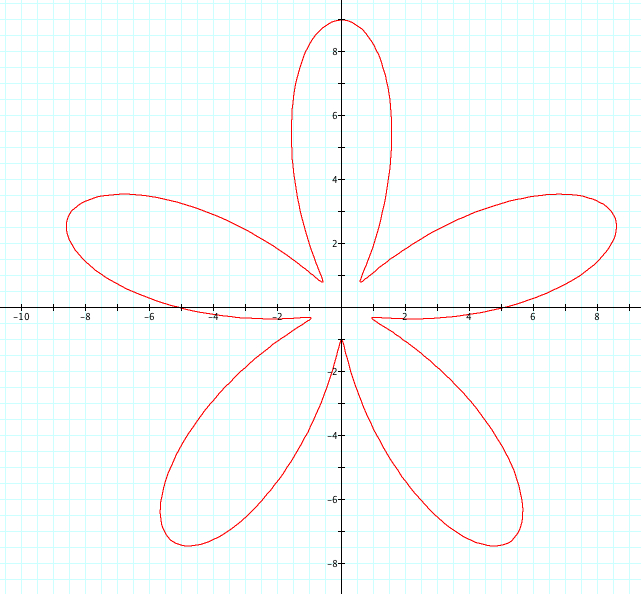
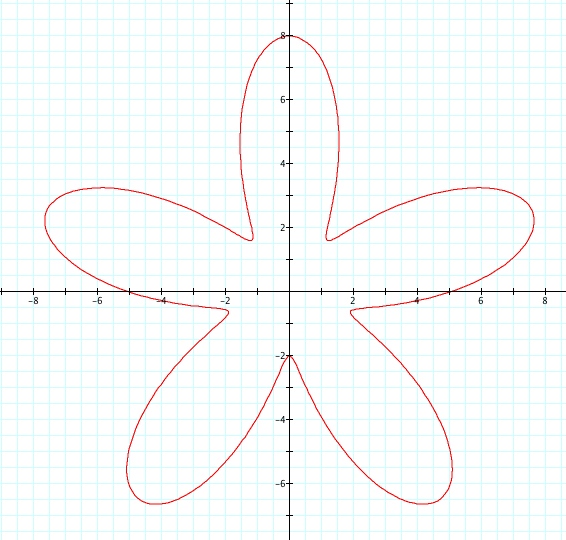
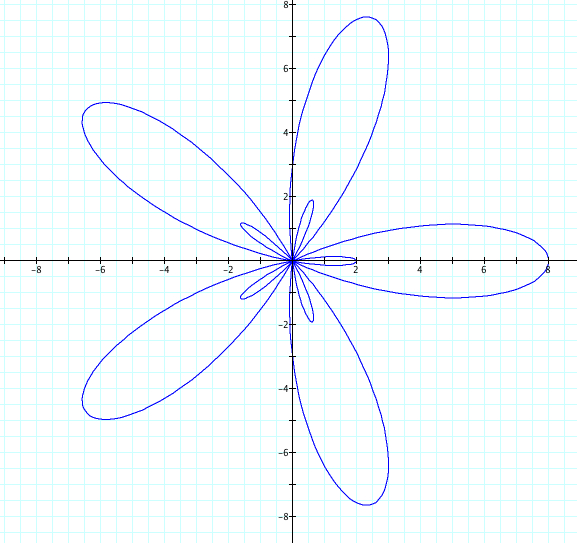
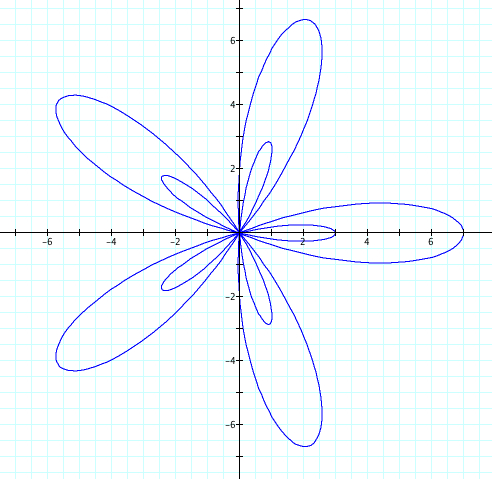
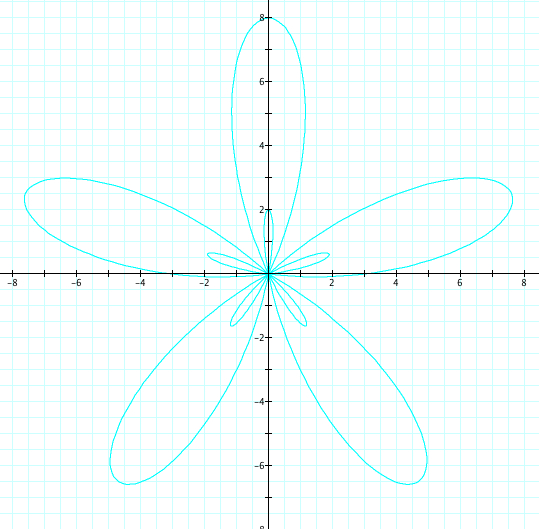
Let's look at r = a + b sin(kθ), where k=5, b=5, and a varies from 1 to 4. Therefore, a<b.
 |
 |
 |
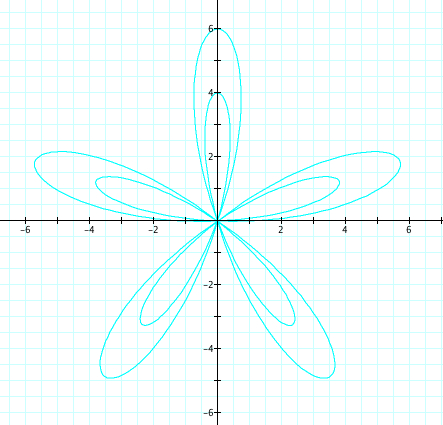 |
No suprise here! All of our discoveries seem to be confirmed!!
Let's see an animation of these:
| r = a + b cos(kθ) and k is varied from 0 to 10 | r = a + b sin(kθ) and k is varied from 0 to 10 |
In both animations, you can see the change in the graphs as a>b, a=b, and a<b.
In conclusion, let's summarize what we have discovered about the polar coordinate system:
1) |k|=number of petals
2) a + b = petal length
3) when k is even and r = a + b cos(kθ), the graphs of the positive and negative values of k are reflection over the y axis
4) when k is even and r = a + b cos(kθ) the graph of positive k and negative k are the same
5) when k is odd and r = a + b sin(kθ), the graphs of the positive and negative values of k are reflection over the x axis
6) when k is even and r = a + b sin(kθ, the graph of positive k and negative k are the same
7) when r = a + b cos(kθ), petals cross the y axis before reaching their maximum length of the value of a
8) when r = a + b sin(kθ), petals cross the x axis before reaching their maximum length of the value of a
9) when r = a + b cos(kθ) and a>b, the graph crosses the x axis at the length of the petal and at the value of b-a
10) when r = a + b sin(kθ) and a>b, the graph crosses the y axis at the length of the petal and at the value of b-a
11) when r = a + b cos(kθ) and a<b, the graph has an additional set of smaller petals, inside the larger petals, with length of b-a
12) when r = a + b sin(kθ) and a<b, the graph has an additional set of smaller petals, inside the larger petals, with length of b-a
It is clear from these 4 explorations that there is much to know and learn about the Polar coordinate system. Other questions could be explore a<b and a>b when a and b are negative values or one is negative and on is positive.