
Kate Berryman
cavaleri@uga.edu
*Please make sure your browser is maxiumized to view this write up;
In mathematics, the general form of a quadratic equations is:
![]()
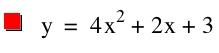
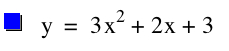
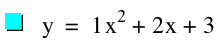
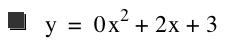
The letters a, b, and c represent constants and therefore, as they vary, the graph of the equation will also change. Let's explore this a bit by choosing different values for a and seeing the affect the change has on our equation. Lets set b=2, c=3, and let a vary from -4 to 4.
 |
 |
 |
|
 |
 |
 |
 |
 |
|||
 |
|||
 |
 |
 |
 |
Watch the animation of the graph as the values of a change from 4 to -4.
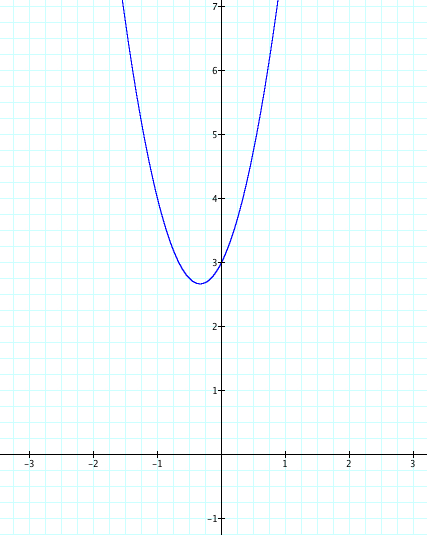
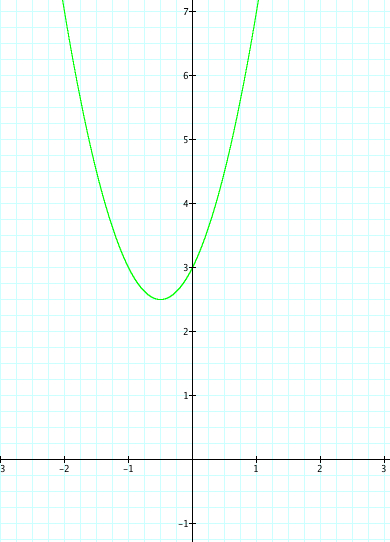
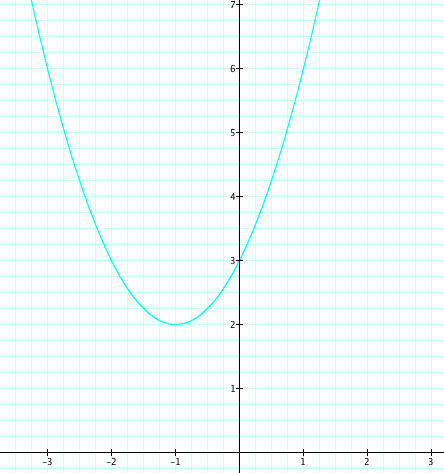
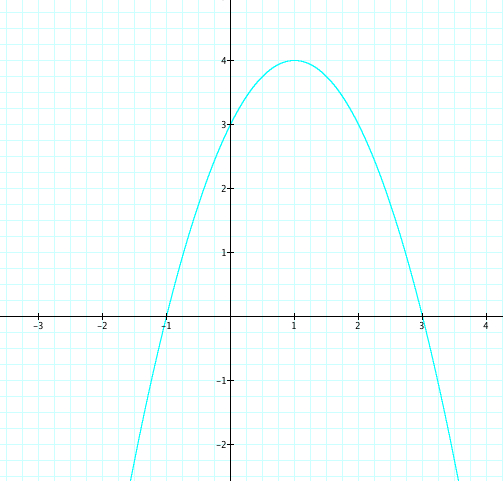
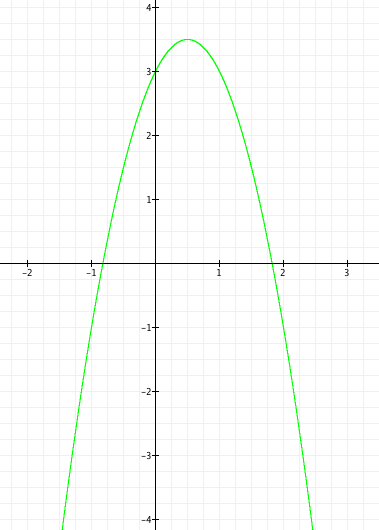
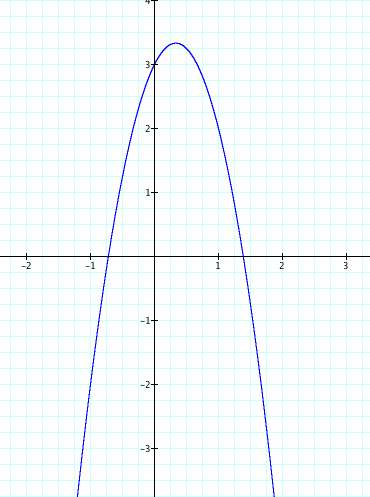
As a changes, we see that when a is positive the parabola opens up and when a is negative the parabola opens down. Why is this? When we consider the graph of y=x^2.
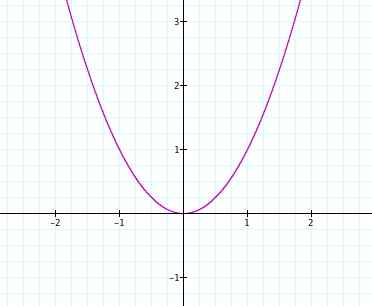 |
We can think about this as y=x^2+0x+0, where a=1, b=0, and c=0. Conversly, when we have y=-x^2 is equal to y=-x^2+0x+0, where a=-1, b=0, and c=0. The graph of this equation opens down.
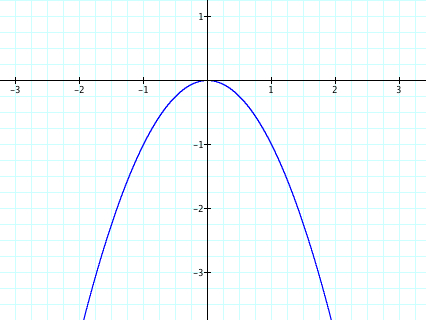 |
This helps us to understand why when a is positive the parabola will open up and when a is negative the parabola will open down.
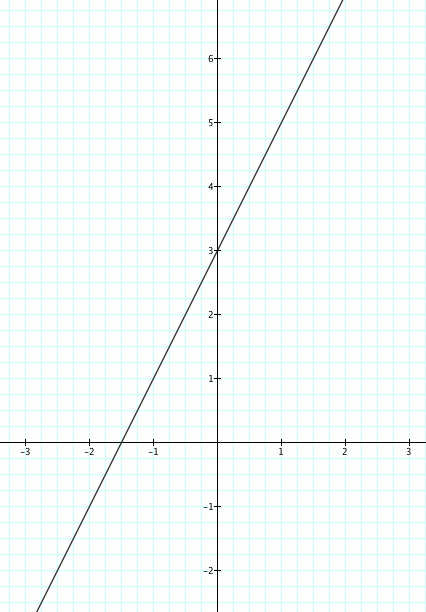
Let's also observe when a=0. We see that this graph is just a straight line. Intuiativley, this is obvious because when a is 0, then we are left with the equation y = 2x +3. This is just the equation of a line with a positive slope that passes through (3,0) and (0, 3/2).
Something else to be noticed is as a moves from 4 to -4 the opening on the parabola gets wider as a gets closer to zero. As the value of a moves away from zero the opening in the parabola gets more narrow.
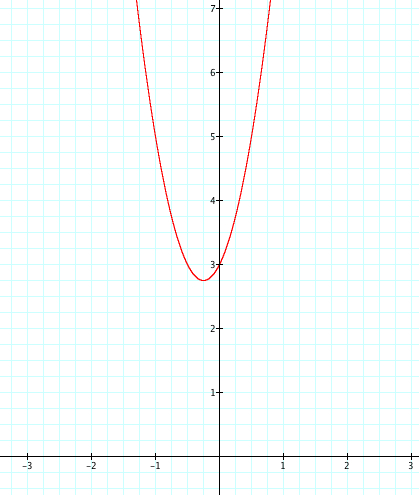
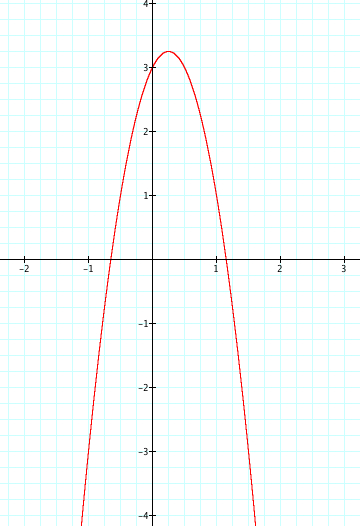
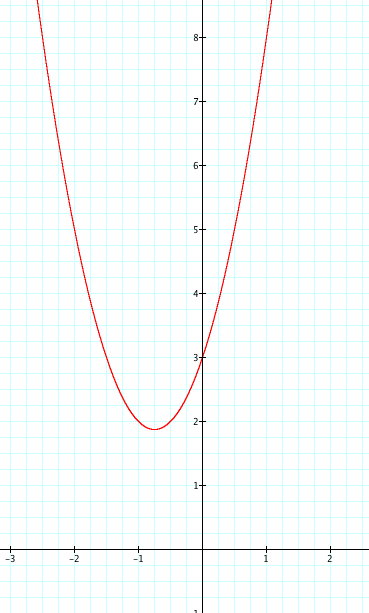
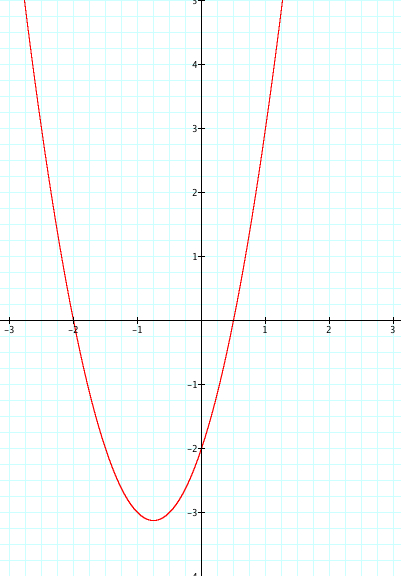
Yet, no matter the value of a, we see that the parabola always passes through the point (0,3). As we teach our students the affects of our changing a, we should ask them why is the happening? We know that when x=0, then y=3, therefore we have our graph passing through (o,3). Therefore is it safe to assume that the value of c affects where our parabola crosses the x axis?
Now let's set a=2 and b=3. What happens when we change that value of c?
As discussed above, we set c to equal 3, so our parabola crossed the y axis at (0,3). Now that we are varying the value of c, it is important to notice that the parabola crosses the y axis at different places as the value changes. Let's take the equation:
![]()
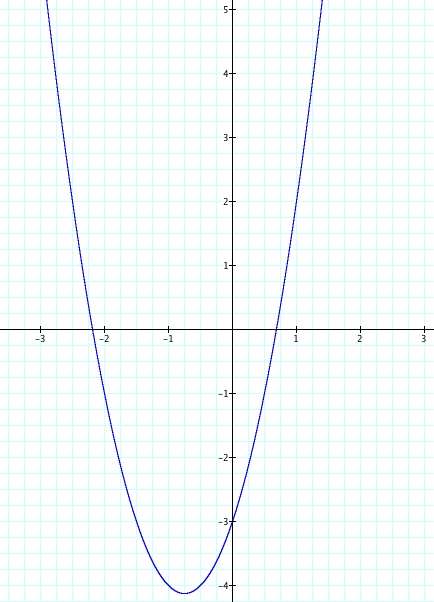
Let choose a our value of x=0 to get an idea. So if x=0, after solving, then y=4. Let's check our graph to see if to equation of this parabola crosses the y axis at the point (0,4).
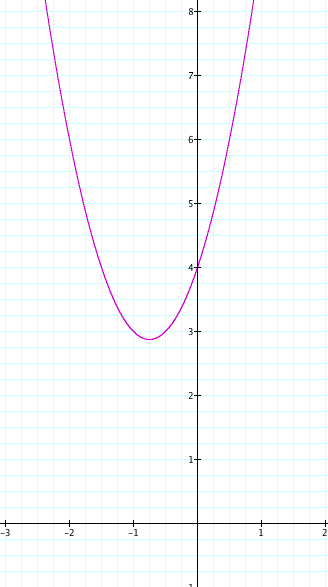 |
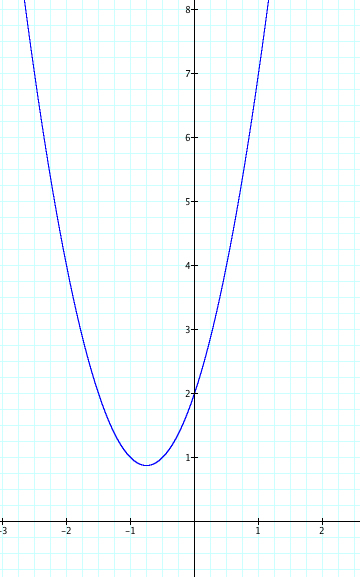
We see that in fact our parabola does cross the y axis at (0,4). Let's look at the other equations, as c is varied from 3 to -4 to see if this is also true.
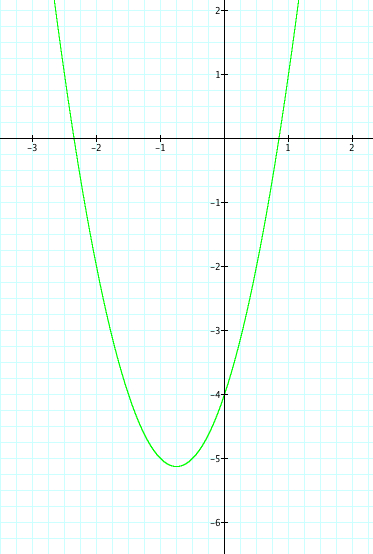
When x=0 the y=3. Therefore the parabola crosses the y axis at (0,3) |
When x=0 the y=2. Therefore the parabola crosses the y axis at (0,2) |
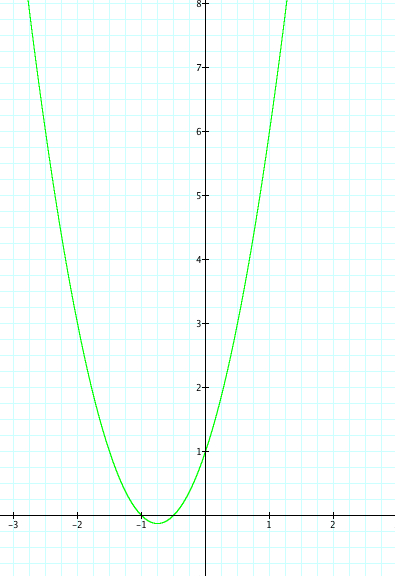
When x=0 the y=1. Therefore the parabola crosses the y axis at (0,1) |
When x=0, then y=0. Therefore the parabola crosses the y axis at (0,0). |
 |
 |
 |
|
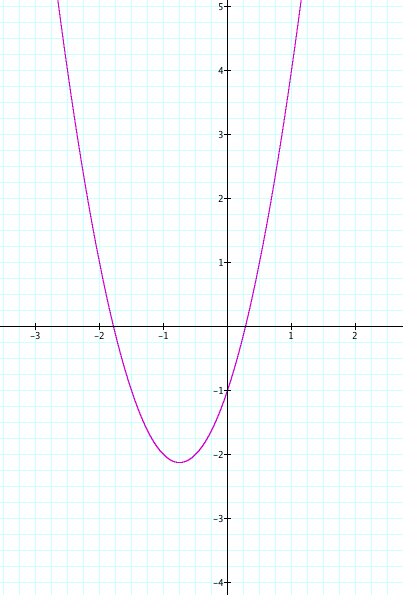
When x=0 the y=-1. Therefore the parabola crosses the y axis at (0,-1) |
When x=0 the y=-2. Therefore the parabola crosses the y axis at (0,-2) |
When x=0 the y=-3. Therefore the parabola crosses the y axis at (0,-3) |
When x=0 the y=-4. Therefore the parabola crosses the y axis at (0,-4) |
 |
 |
 |
 |
Now, we should vary the value of b and see the affects that this has on our parabola. Look on to Assignment #3 for this exploration.
