Assignment # 10
Explorations with Parametric Equations
by Michael Ferra
Proposed Investigation
A parametric curve in the plane is a pair of functions
x = f(t)
y = g(t)
where the two continuous functions define ordered pairs (x, y). The two equations are usually called the parametric equations of a curve. The extent of the curve will depend on the range of t and your work with parametric equations should pay close attention to the range of t. In many applications, we think of x and y "varying with time t" or the angle of rotation that some line makes from an initial location.
Let's graph several sets of curves for
x = a + t
y = b + kt
for selected values of a, b, and k in an appropriate range for t.
i. Set a = 1, b = 1 and set the range of t as -2 ⩽ t ⩽ 2. Observe for different values of k.
ii. Set a = -1, b = 1 and set the range of t as -2 ⩽ t ⩽ 2. Observe for different values of k.
iii. Set a = 1, b = -1 and set the range of t as -2 ⩽ t ⩽ 2. Observe for different values of k.
iv. Set a = -1, b = -1 and set the range of t as -2 ⩽ t ⩽ 2. Observe for different values of k.
v. Generalizing our observations.
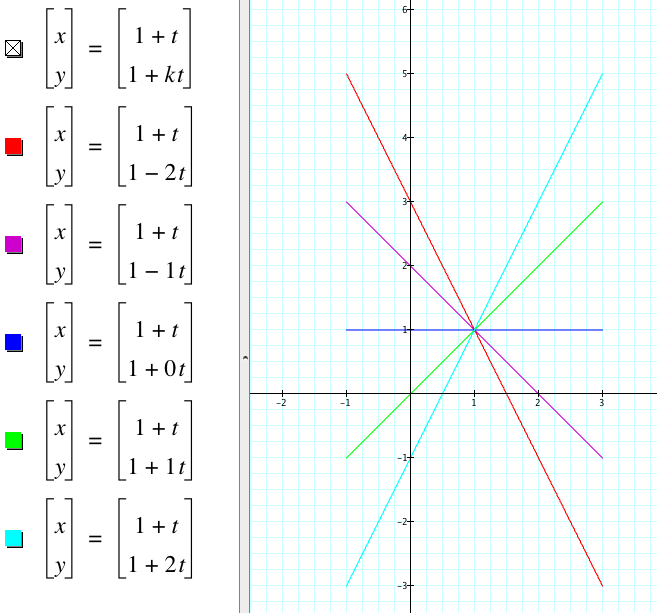
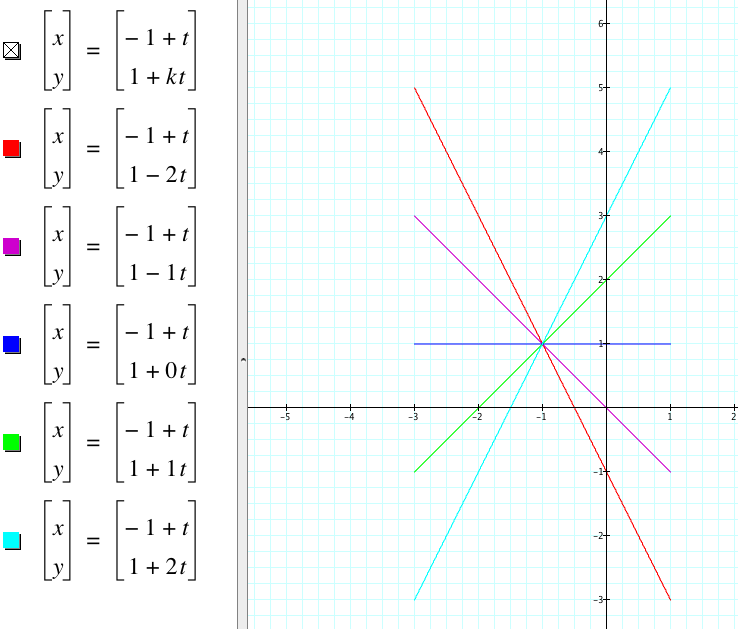
i. Set a = 1, b = 1 and set the range of t as -2 ⩽ t ⩽ 2. Observe for different values of k.
Here we've set a = 1, b = 1, and -2 ⩽ t ⩽ 2. Let's vary the values of k from -2 to 2 for integer values.
What observations can we make from these graphs?
- The graphs appear to be line segments, each with domain [-1,3].
- Each graph has a different slope. The slope for each graph is its respective k value.
- The graphs seem to have a point of concurrency at the point (1, 1).
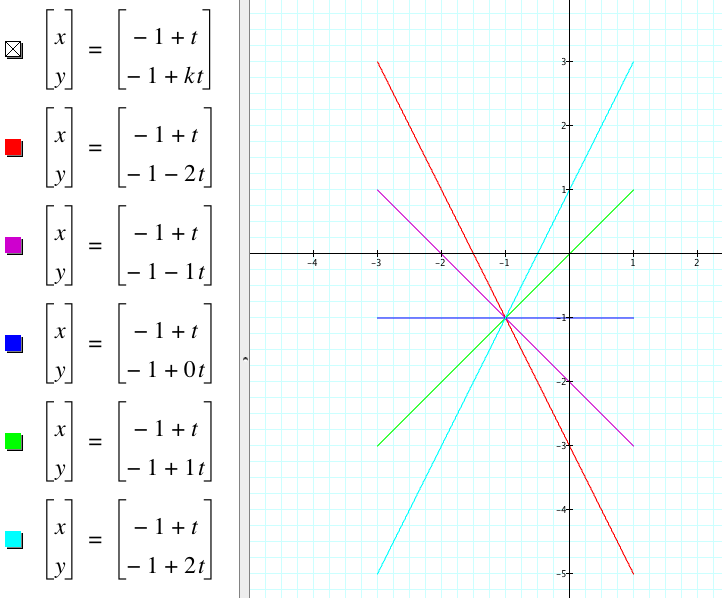
ii. Set a = -1, b = 1 and set the range of t as -2 ⩽ t ⩽ 2. Observe for different values of k.
Here we've set a = -1, b = 1, and -2 ⩽ t ⩽ 2. Let's vary the values of k from -2 to 2 for integer values.
What observations can we make from these graphs?
- The graphs appear to be line segments, each with domain [-3,1].
- Each graph has a different slope. The slope for each graph is its respective k value.
- The graphs seem to have a point of concurrency at the point (-1, 1).
iii. Set a = 1, b = -1 and set the range of t as -2 ⩽ t ⩽ 2. Observe for different values of k.
Here we've set a = 1, b = -1, and -2 ⩽ t ⩽ 2. Let's vary the values of k from -2 to 2 for integer values.
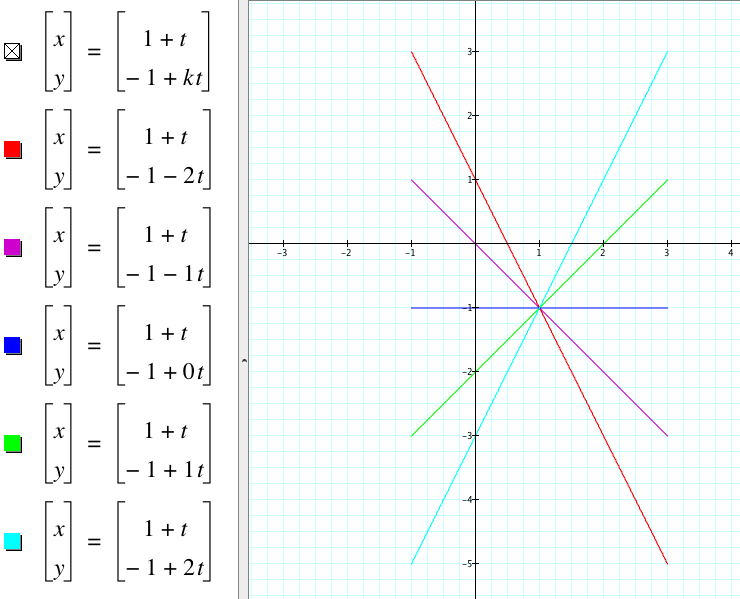
What observations can we make from these graphs?
- The graphs appear to be line segments, each with domain [-1,3].
- Each graph has a different slope. The slope for each graph is its respective k value.
- The graphs seem to have a point of concurrency at the point (1, -1).
iv. Set a = -1, b = -1 and set the range of t as -2 ⩽ t ⩽ 2. Observe for different values of k.
Here we've set a = -1, b = -1, and -2 ⩽ t ⩽ 2. Let's vary the values of k from -2 to 2 for integer values.
What observations can we make from these graphs?
- The graphs appear to be line segments, each with domain [-3,1].
- Each graph has a different slope. The slope for each graph is its respective k value.
- The graphs seem to have a point of concurrency at the point (-1, -1).
v. Generalizing our observations.
Looking at the graphs, and their respective observations, for the parametric equations above, there seems to be some common properties among them all.
What generalized observations can we infer?
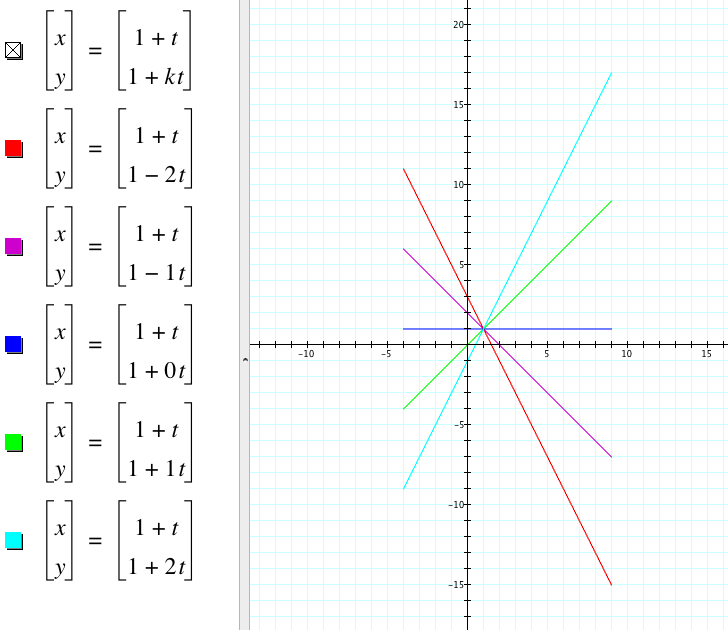
- The domain of each set of parametric equations is found by taking the two extreme values of t and adding a to each. In our first example we a range of t = [-2, 2] and an a = 1, thus our extreme values for t are -2 and 2. To find the domain of our parametric equations we do [-2 + 1, 2 +1] thus our domain is [-1, 3]. Let's take our first example with a = 1, b = 1 and observe a range of t = [-5, 8], thus our extreme values are -5 and 8. To find the domain of our parametric equations we perform the same operation [-5 + a, 8 + a] and since a = 1, our domain should be [-4, 9]. Let's vary the values of k from -2 to 2 for integer values and see if our general observation still holds true.
Making an observation of the graph, it checks out that our domain is [-4, 9], just as we suspected! Notice changing the range for t didn't change anything else except for the domain of the parametric equations.
- The slope for each graph is defined by its respective value for k. Thus k tells us the slope of the parametric equations.
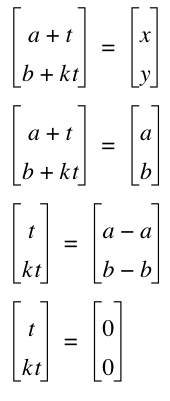
- The graphs have a point of concurrency at (a, b). Notice this only happens when t = tk = 0. If our range of t does not pass through the value of 0, then there will be no point of concurrency. Observe:
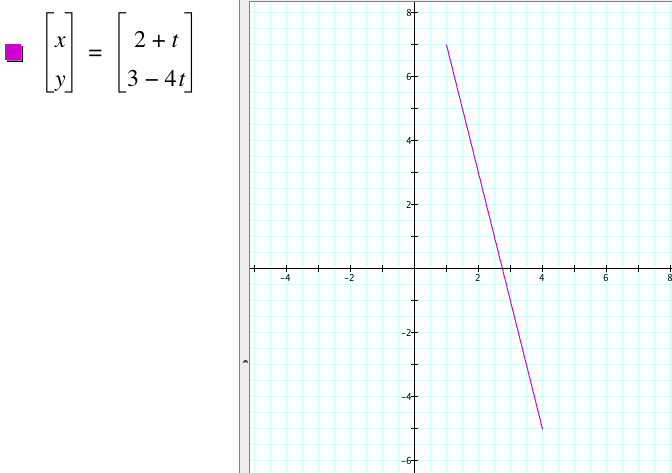
*Let's define a line segment that goes through the point (2, 3), has a slope of -4 and a range of -1⩽ t ⩽ 1. From our general observations we know:
- k = slope so k = -4
- The line segment goes through the point (2, 3), thus a = 2 and b = 3.
- Since -1⩽ t ⩽ 2, our extreme values for t will be -1 and 1, thus our domain will be [-1 + 2, 1 + 3] or [1, 4].