
Exploring problems of growth.
By Raynold Gilles.
Exploring problems of growth.
By Raynold Gilles.
In this write up we will be exploring a couple of growth functions. For practicality purposes we will be using savings accounts as well as bacteria to model our growth functions.
First we will use excell to generate our values in order to help us graph the function for the Scenario below:
SAVINGS ACCOUNTS
Mary invested $1000 in an account. Her account compounds interest yearly at a rate of 8.5 %. Create a graph with units in thousands that represents Mary's account balance over time.
The values generate can be observed by clicking the link below.
Account Balance at a given time.
Below is the graph representing the Account balance at a given time.
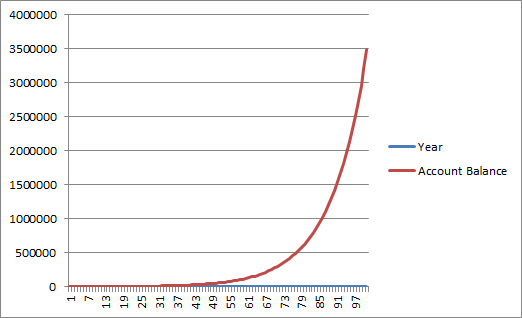
Assuming that students have been exposed to Growh and decay functions; the rationale behind using excell would be to identify functions as growth or decay.
Next we will use excell to compare savings account with similar interest rates but different compounding periods.
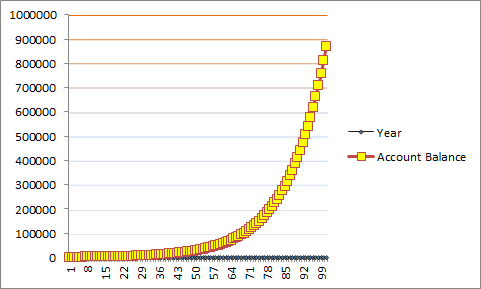
First we will investigate an account with a 7% interest rate compounded yearly.
Click on the link below to see different balances of a savings account with a 7% interest compounded yearly.
The graph corresponding to such a situation where interest is compounded yearly is given below.
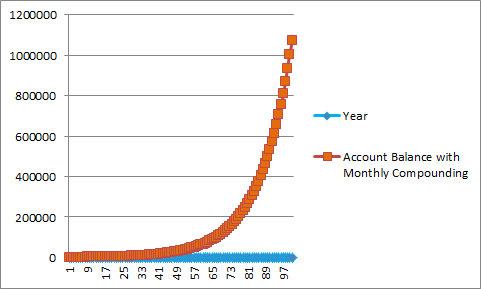
Next we will investigate a situation where interest is compounded monthly.
Click on the link Below to find out how much money will be in the account if deposited for 100 years. One can notice that this amount is considerably higher than the one where interest was compounded yearly.
The graph of such a situation where interst is compounded monthly is given below and is pictured In Orange.
BACTERIA GROWTH
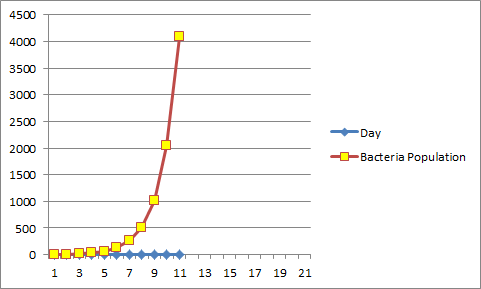
In this scenario will use excell to model an experiment where the experimenter starts with 4 bacteria and where the amount of bacteria doubles daily.
The function representing such a scenario is
![]()
Where 'x' represents the day and 'y' represents the number of bacteria.
A small snapshot of the Excell Spreadsheet is pictured below.
| Day | Bacteria Population |
| 0 | 4 |
| 1 | 8 |
| 2 | 16 |
| 3 | 32 |
| 4 | 64 |
| 5 | 128 |
| 6 | 256 |
| 7 | 512 |
| 8 | 1024 |
| 9 | 2048 |
| 10 | 4096 |
| 11 | 8192 |
| 12 | 16384 |
| 13 | 32768 |
| 14 | 65536 |
| 15 | 131072 |
| 16 | 262144 |
| 17 | 524288 |
| 18 | 1048576 |
| 19 | 2097152 |
| 20 | 4194304 |
One can clearly observe that the population of Bacteria Quickly Grows.
Below is a graph representing the population of bacteria.
Conclusion:
Excell can be a powerful tool in helping students investigate exponential functions. Hence I believe that students should use it in order to help them make discoveries as well as in helping them make multiple representations of exponential functions.
All computations required to draw different graphs were completed in matters of seconds.