
The graphs of Parabolas
By Raynold Gilles.
The graphs of Parabolas
By Raynold Gilles.
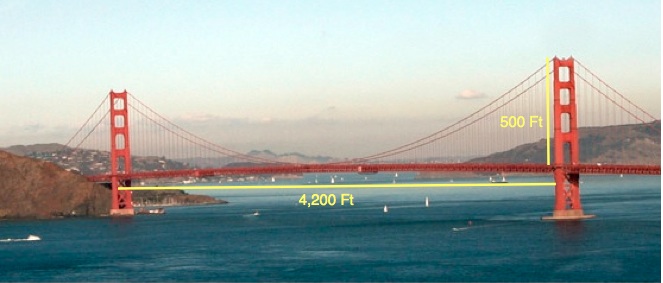
In this write up we will be investigating parabolas. Parabolas have several real world applications. A good example of their applications can be observed in balistic. When one launches a rocket, the trajectory of such a rocket is desribed by a parabola.
Below are real life examples where one comes in contact wih parabolas.

We will focus on investigating different transformations of the graph of parabolas
Some Parabolas have equations of the form "ax² + bx +c" . and "a(x-h)² + k " We will call these "Parabolas in "x" in this write up"
Other parabolas have equtions of the form "ay² + by +c" and "a(y-h)² + k". We will call these " Parabolas in "y" ".
The graphs of the first type of parabolas are shown below. Notice that the parabolas are symmeric to the Y axis.
![]()
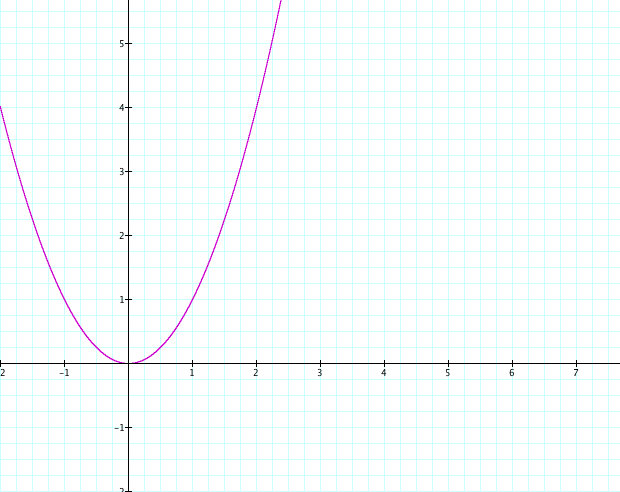
Above is the parabola with equation y = x²
Below is the equation for y =-x²
![]()
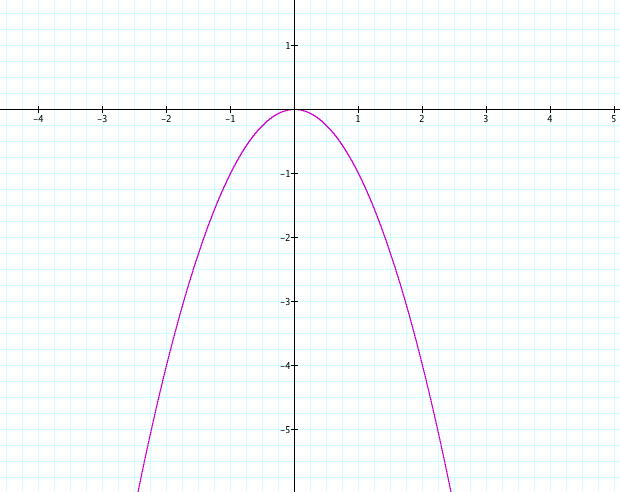
y = -x²
We notice that both graphs have a vertex at the origin and are reflection of each other. Hence one can conclude that a negative coefficient on the quadratic term implies that the parabola opens up downward. Similarly, the opposite would be true when the coefficient is positive on the quadratic term.
Below we will observe the parabolas given by the second set of equations described earlier when both b and c are zero.
The red graph represents x = -y² and the purple graph represents x = y²
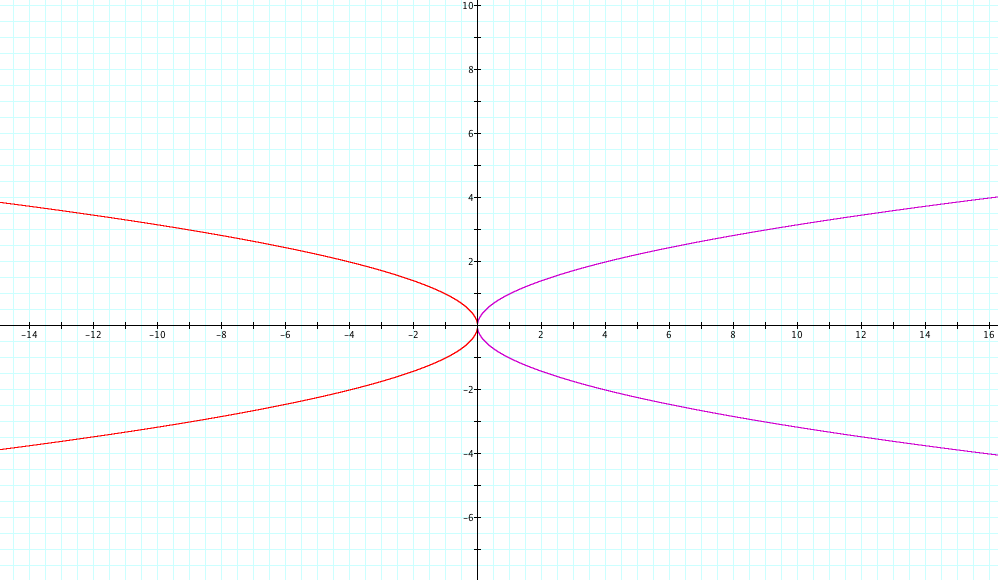
The Major conclusion to be made from constrasting the first type of parabolas with the second type is that parabolas in "y" are merely what happens if a parabola in "x" was to be rotated.
Now, we will investigate the changes in the graph when a varies. Let us consider the equation ax² + 2x +2 with values of a between -5 and 5.
![]()
![]()
![]()
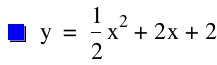
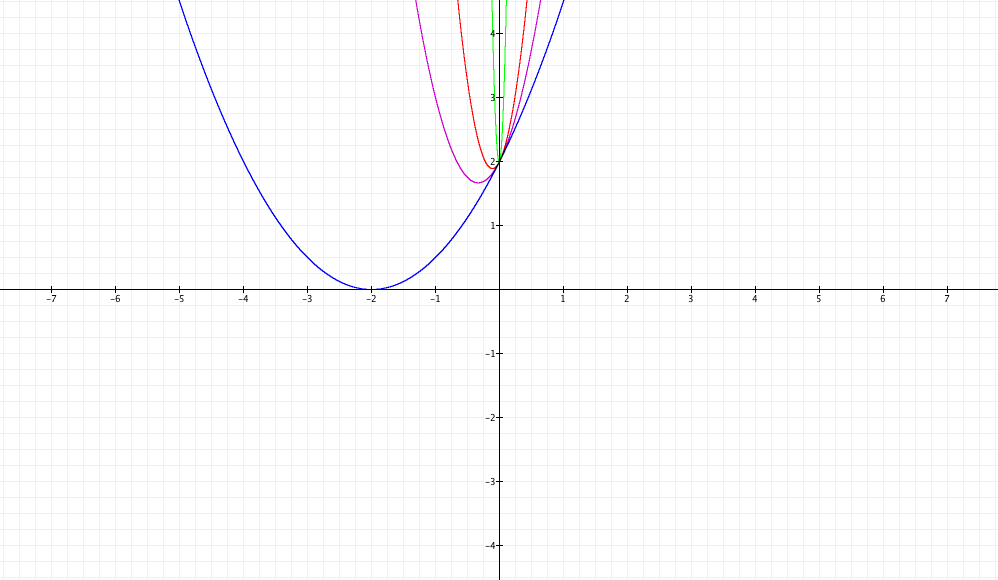
Investigation of the graph above shows that when "a" is a fraction , the graph shrinks and the larger the denominator of the fraction is, the bigger the shrink.
Similarly, larger values of a strech the graph.
The y-intercept stays constant at (0,2). Here "2" is our value of c. Hence a change in the value of 2 will shift our graph horizontally.
Next, we will investigate the changes in the graph when b varies. Let us consider the following equations with their graphs on the left.
Conclusions:
The value of "c" gives us the y intercept
A negative value of "b" implies that the x coordinate of our vertex is positive and the opposite is true when "b" is negative.
Next we will focus on c. The value of "c" affects our horizontal shifts. Lets examine four graphs with the same value of a and b.
![]()
![]()
![]()
![]()
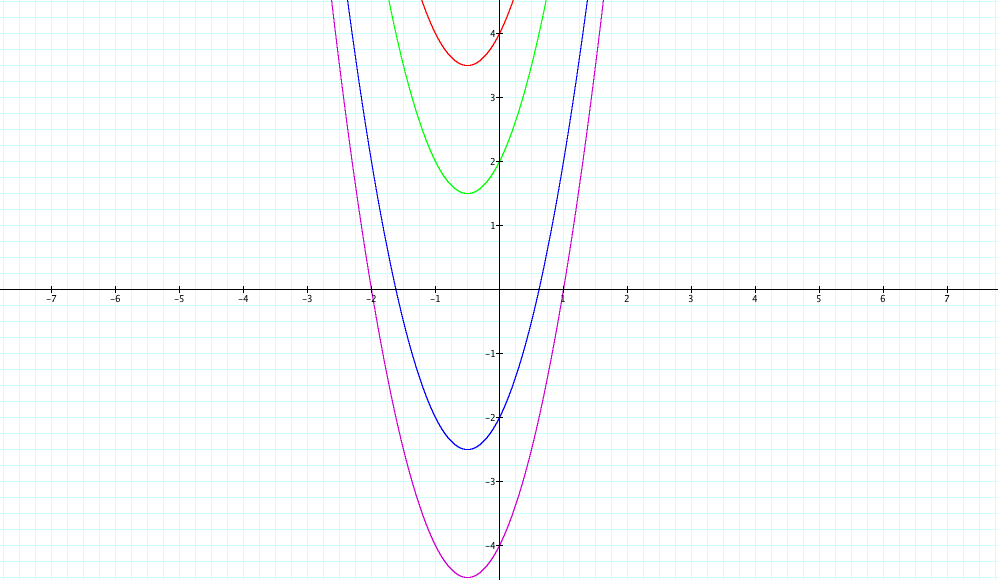
Examination of the graphs and their equations suggest that a positive value of "c" leads to a upward shift of c units and that a negative value of c leads to a downward shift of c units.
Conclusions:
The y-intercept increases as the value of c increases.
The value of "c" determines the y intercept and the amount of the horizontal shift.
One can therefore conclude that the value of a affects both a parabolas opening as well as the vertical stretch and/or shrink .The value of b shifts the parabola horizontally and the value of c shifts the parabola vertically. Note that all investigations above were made for only for the first type of parabolas. That is , parabolas in "x". Similar results can be observed for parabolas in x. The major difference would be that everything is rotated 90 degrees.