Examining the Grahps of parametric Trigonometric functions For different Cases.
By Raynold Gilles.
Examining the Grahps of parametric Trigonometric functions For different Cases.
By Raynold Gilles.
Problem 10 of assignment 10 ask us to investigate the following :
The problem requires us to investigate parametric equations three possible cases.
Case #1: a=b
Case #2: a<b
Case #3: a>b
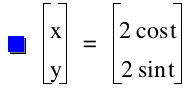
Part A: Let us Investigate x=acost(t) and y=bsin(t)
Case 1:
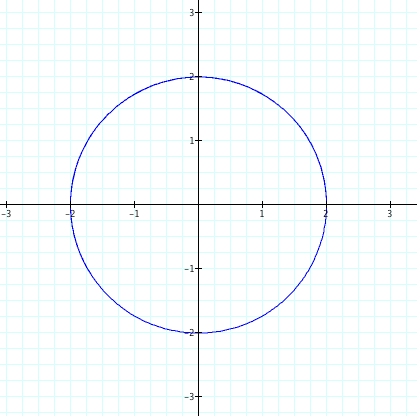
Let us consider the case where both a and b are equal 2. Clearly this results in a circle of radius 2.
Below are both the Graph and the Equation
Nonetheless, one example is not enough to make a generalization.
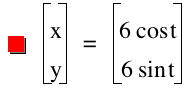
Next we will consider the case where both a and b are equal to 4. This results in a circle of radius 4. At this point one needs an additional example to make a generalization. Both the Graph and equations are provided below.

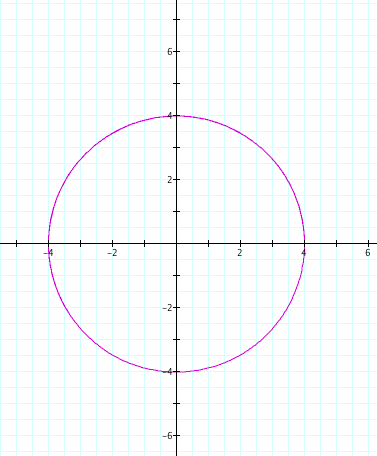
We will next consider the case where both a and b are equal to 6. The circle we obtain has a radius of 6.
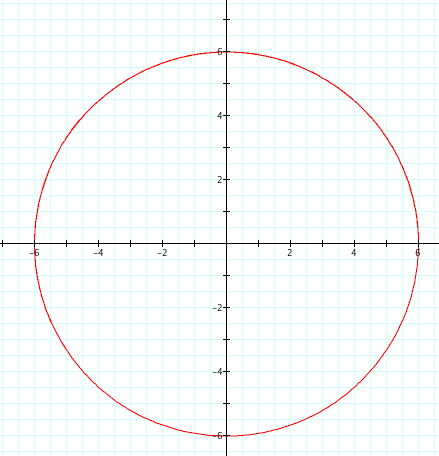
As a result, we can conclude that equal values of a and b result in a circle whose radius is determined by the values of a and b.
Case2
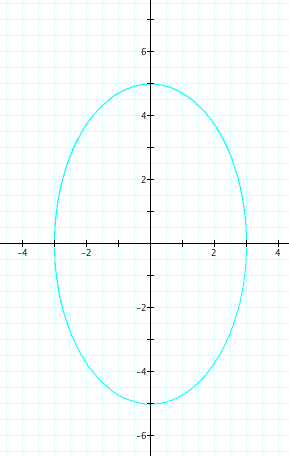
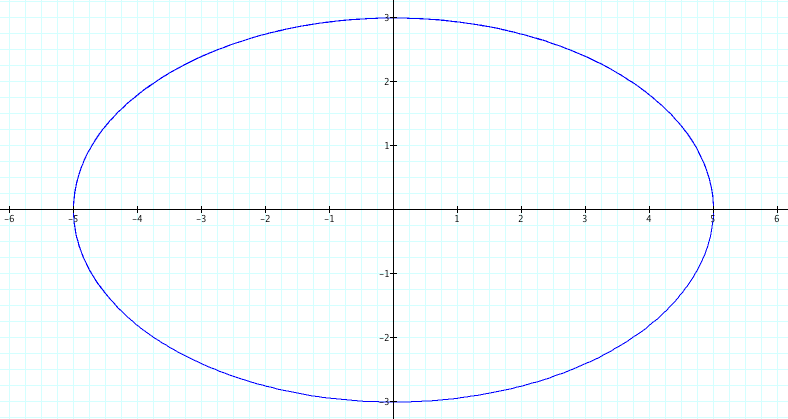
Lets examime cases where a<b. By setting a=1 and b=3, we create an ellipse with a vertical major axis and horizontal minor axis. Below are the equation and its graph.
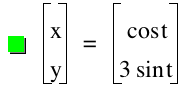
Furthermore, the minor axis has a length=2 while the major axis has a length=6.
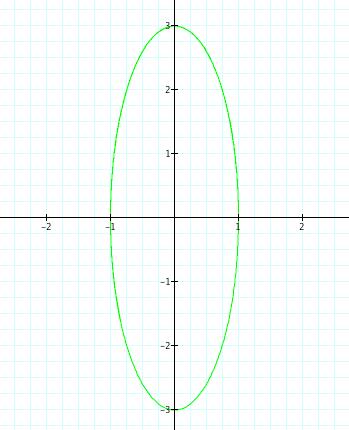
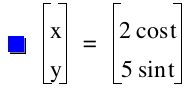
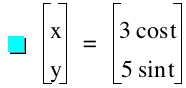
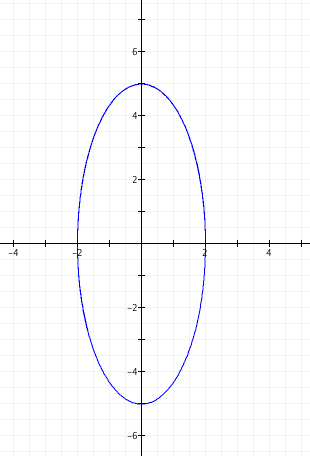
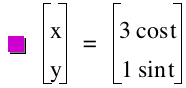
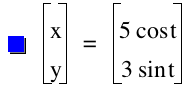
Next We will next consider cases where a=2 and b=5 as well as the case where a=3 and b=5. Below are the color coded equations and graphs that suggest the following:
.A value of a<b creates an elliplse with a vertical major axis.
.The length of the axes are double the respective values of a and b.
Equations with their Graphs
Case 3:
Let us examine cases where a>b. By setting a=3 and b=1, investigations using graphic calculator suggest that we create ellipses with a horizontal major axis and a vertical minor axis are created.

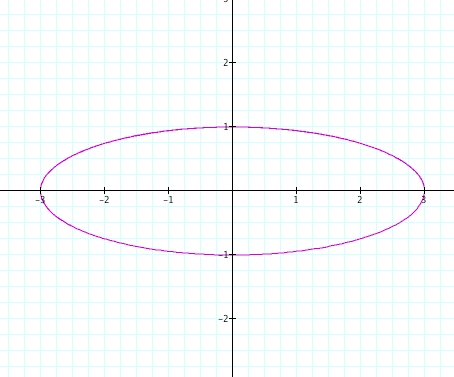
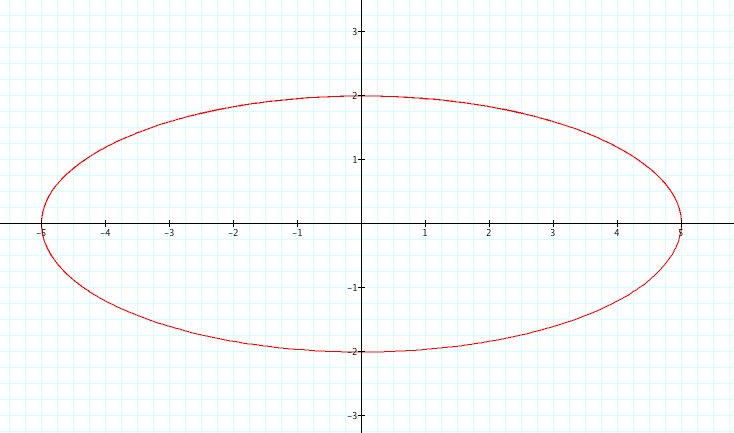
The pictures above with their equations suggest the following:
.A value of a>b creates an ellipse with a Horizontal major axis.
.The length of the axes are double the respective values of a and b.
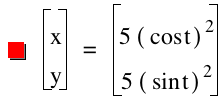
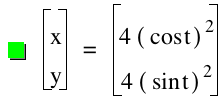
PART B:We will investigate second degree equations in this part.
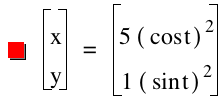
Below are both the color coded equations with their graphs when a and b are equal.

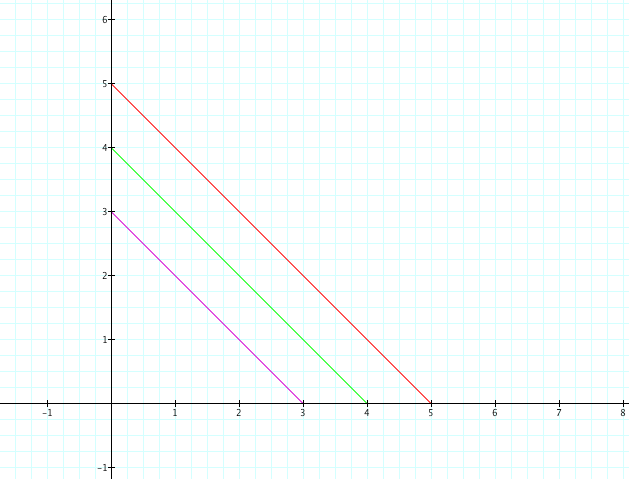
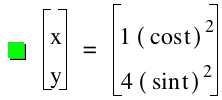
And the equations and graphs of the same equations when a and b are not equal.

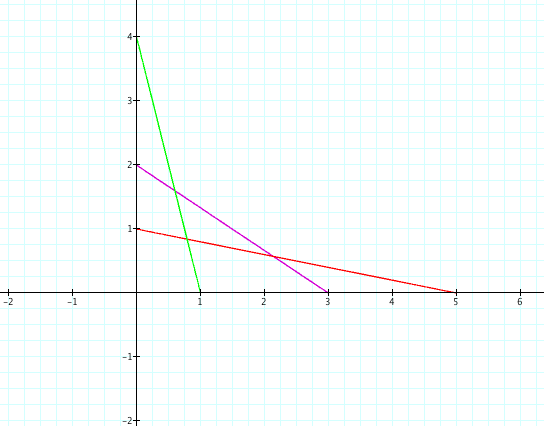
From the graphs above with their equations, the following observation can be made:
Second degree parametric equations results in lines that are in the first quadrant. Furthermore the value of a and b determine respective values of the x and y intercepts. For example the line has an "x intercept of value equal to 3 and a "y intercept" of value 2.
PART C:We will investigate third degreeas well as higher power equations in this part.


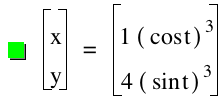
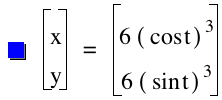
Investigation of the graph above with the matching equations suggest the following:
.The value of a is the absolute value of the x intercetps. For example when a=3, the rhombus like shape has -3 and 3 as x intercepts.
.The value of b is the absolute value of the y inercepts. For example when b =5, the rhombus like shape has -5 and 5 as y intercepts.
. The axis have equal lenghts when a and b are equal and the major can either be vertical when b > a or horizontal when b < a.
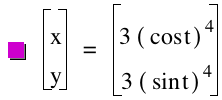
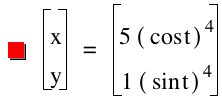


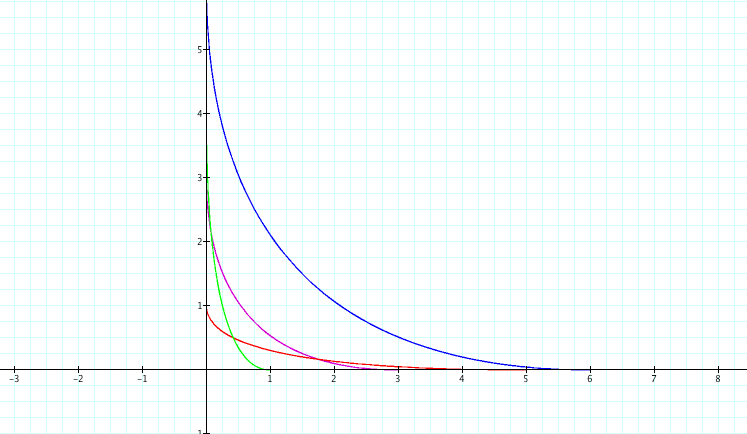
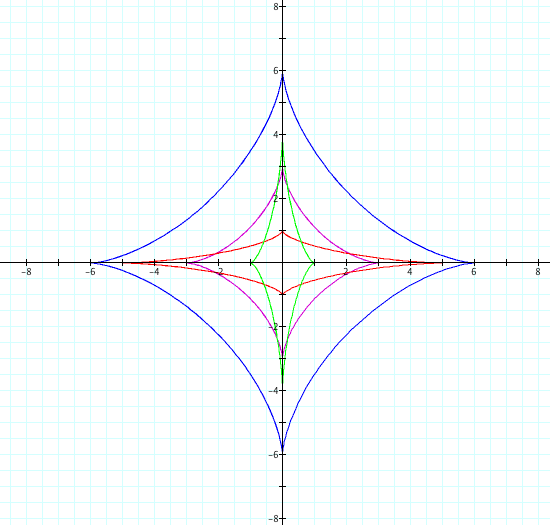
As the power increases but stays even the graphs curves more towards the origin. However the curves stays in the first quadrant when the power is even. This can be observed by investigating the graph below.


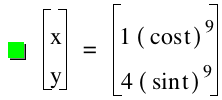
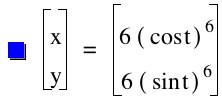
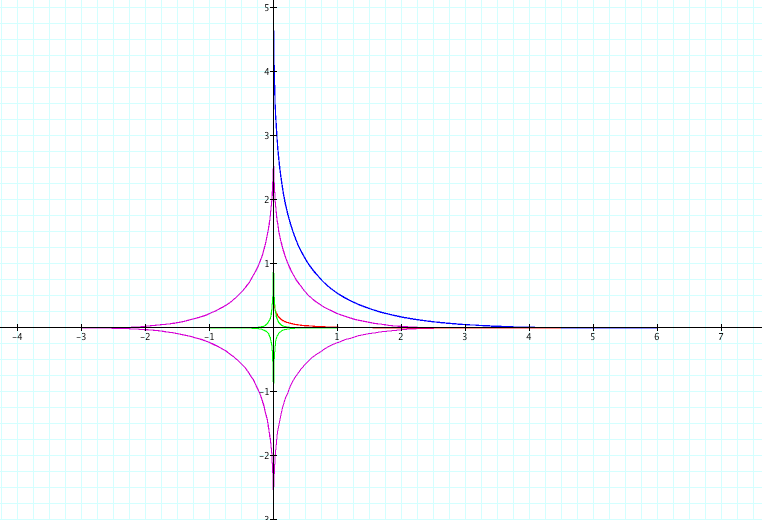
The following generalizations can be made from observing the graph above:
.As the power increases, the graphs, thend curve inward towards the origin.
. Even powers result in graphs that are in the first quadrant while Odd powers results in graphs that are in all 4 quadrants.