Mary Ellen Graves
Assignment 1: Problems and Explorations with Graphing Functions and Relations
Graph the equation:
Mary Ellen Graves
Assignment 1: Problems and Explorations with Graphing Functions and Relations
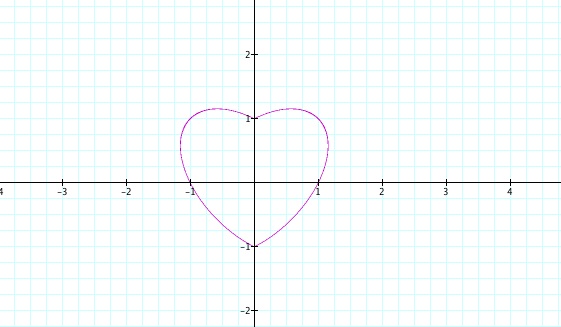
Graph the equation:
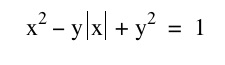
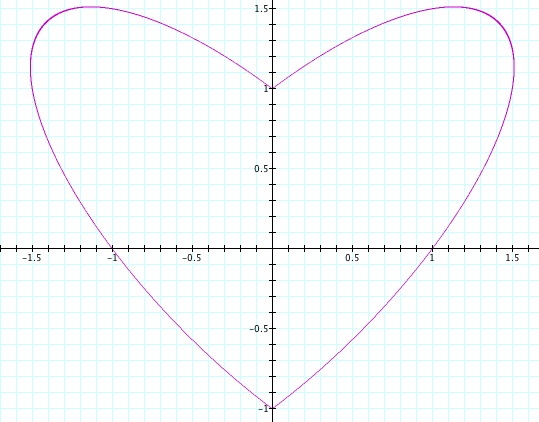
where |x| is the absolute value of x. Variations?
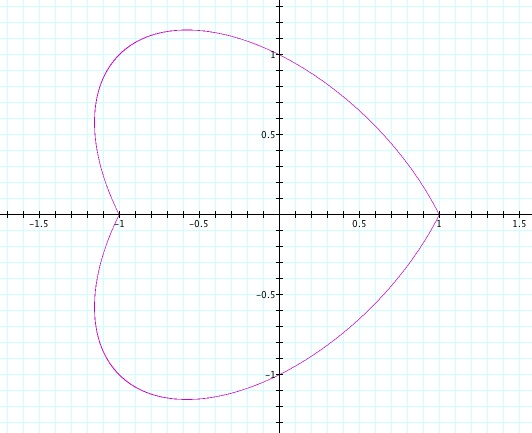
Exploration 1:
Here the graph shows the x and y intercepts to be - 1 and + 1. Recall that the graph of a circle with radius 1 is x^2 + y^2 = 1. The variation of this graph is the additive -y|x|. So the next question is which variables can or should we manipulate to show us variations within this graph? Through graphical manipulations we should be able to understand exactly how this equation behaves and why.
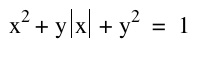
Exploration 2:
By simply changing our (-y|x|) to be positive the entire graph shifts 180 degrees. Does it rotate clockwise or counterclockwise? Are we able to see the rotation step by step or is it only one move with nothing in between? Notice that our x and y intercepts remained the same regardless of the sign of y. Let's take a step away from this expression containing the absolute value of x and look at two graphs below.
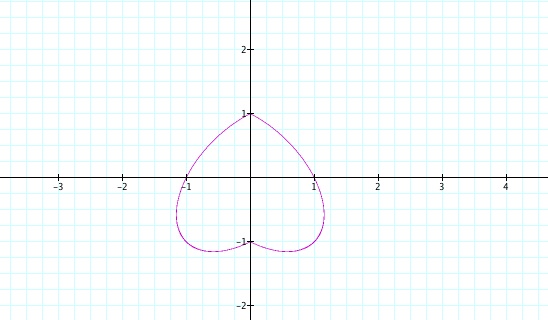
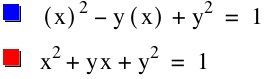
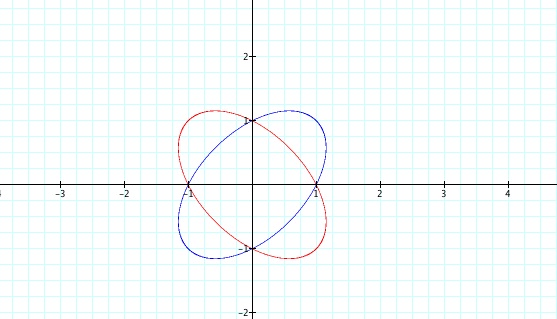
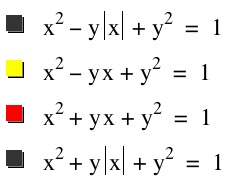
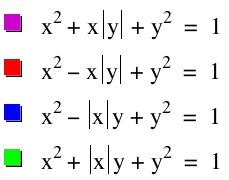
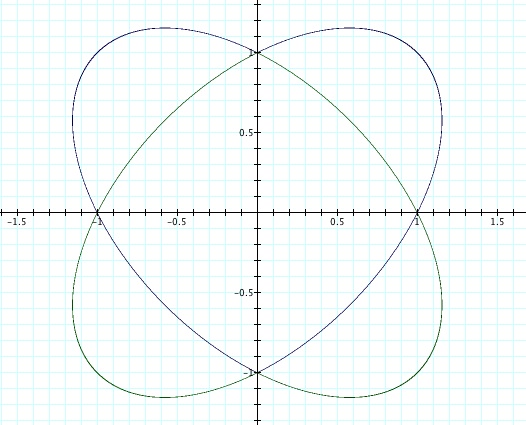
Exploration 3:
Do you see the shape of an upright heart within the two ellipses? Now look for all four heart shapes. Using what we know about absolute values we can see that the red and blue graph represent together part of the graph in Exploration 1. When the graphs from Exploration 1, 2, and 3 are combined all four graphs lay upon one another thus confirming that they are each variations of each other. Notice that the equations labeled black overpower the color of the other equations.
We have confirmed through our graphical manipulations that the "heart shape" is formed by joining two ellipses. But why are the bottoms of the ellipses removed when the absolute value is put around the x? This leads us to our next exploration ...what happens when the absolute value is around the y variable?
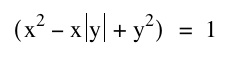
Exploration 4:
By placing the absolute value around the y variable we see that the graph has turned 90 degrees or -90 degrees when x|y| is negative. Now looking back at Exploration 3 we see the two hearts aligned with the x-axis. So now to tie our four explorations together we see that...
forms two ellipses. Our two ellipses above are equal to the ellipses in Exploration 3. Therefore, our final conclusion is by rearranging the absolute value in the graphs we can breaks apart the ellipses to form the "heart shaped" graphs. We can see the truth behind this statement through the graphs above, but what is the mathematical explanation?
Let's take one more look at another exploration to see if it will tie all of the loose ends.
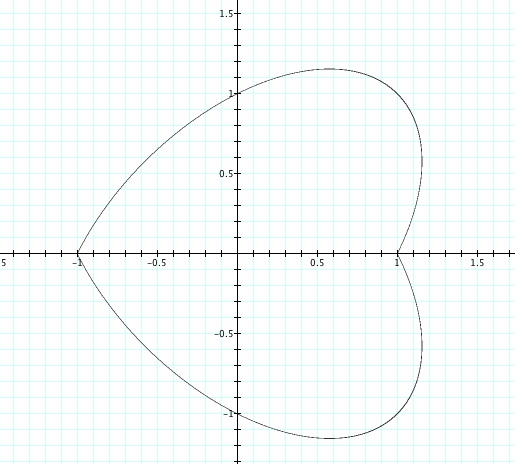
Exploration 5:
Finally, we see what makes the heart stretch. This stretch also works when the absolute value is around the y variable, which maintains the consistency of the graph manipulations. The mathematical explanation for this graph begins first with the x and y intercepts. In all of these explorations the intercepts never changed. No matter how the graph was stretched or where the absolute value is located the intercepts remained -1 and 1 on both the x and y axis. We also see that without the middle term, y|x|, our graph is just a circle with with radius 1. Adding the middle term, yx, we get an ellipse. And adding the absolute value we get the "heart" graph, which flips across the x-axis when the sign of the y variable changes. Using our knowledge of algebraic equations, we can see that for our equation with two squared variables and a middle term to equal one our middle term must always be negative. If the middle term were positive we would end up with an equation greater than 1. Therefore, the "heart" flips across the y-axis when the y variable is positive because we need a negative value of the middle term to maintain equality. Look at the points (1,1), (-1,1), (-1,-1), and (1,-1) in all five explorations. When plugged into our equations we see that the middle value is always negative. Finally, the "heart" stretches according to the value of the scalar multiplied to the middle term.
CLICK HERE TO RETURN TO MY HOME PAGE