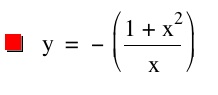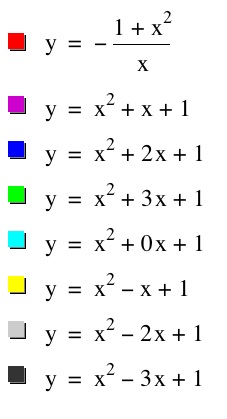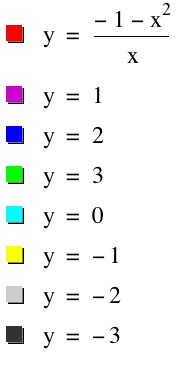
For this assignment we will be exploring graphs in the xb plane. First let's consider the equation x2 + bx + 1 = 0 where b ∈ R. If we graph this equation in the xb plane where y = b we get the graph below and to the left. We will also graph this equation in the xb plane along with the equation y = x2 + bx + 1 where b varies from -3 < b < 3. We will then use this graph to observe the relationship between the roots of the graphs y = x^2 + bx + 1 and the intersection of y = -((1 + x^2)/x) with different values of b. Please make sure your browser is maximized before continuing.
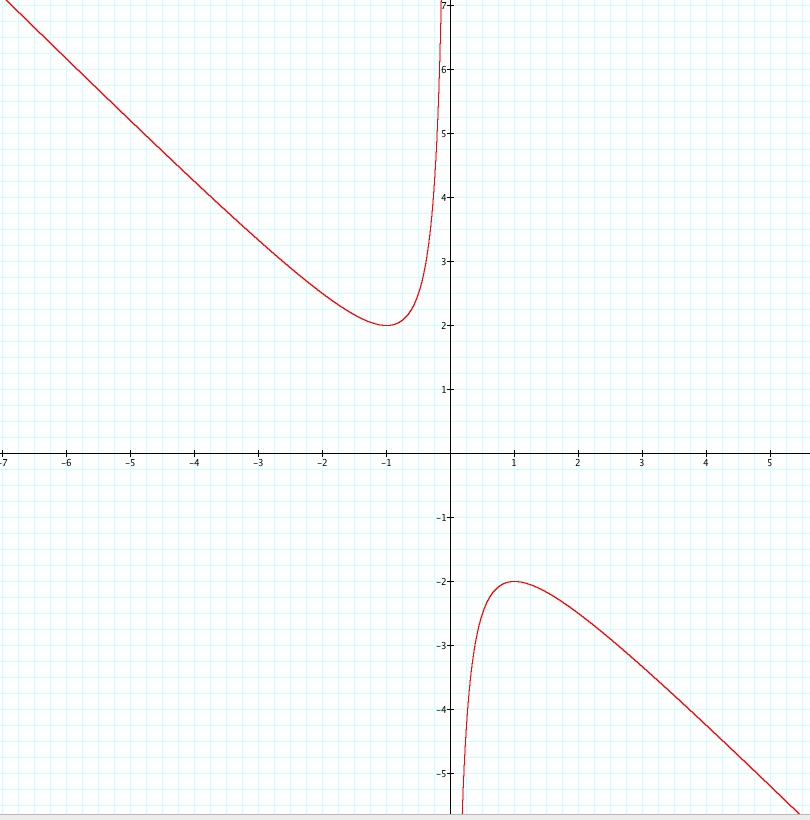
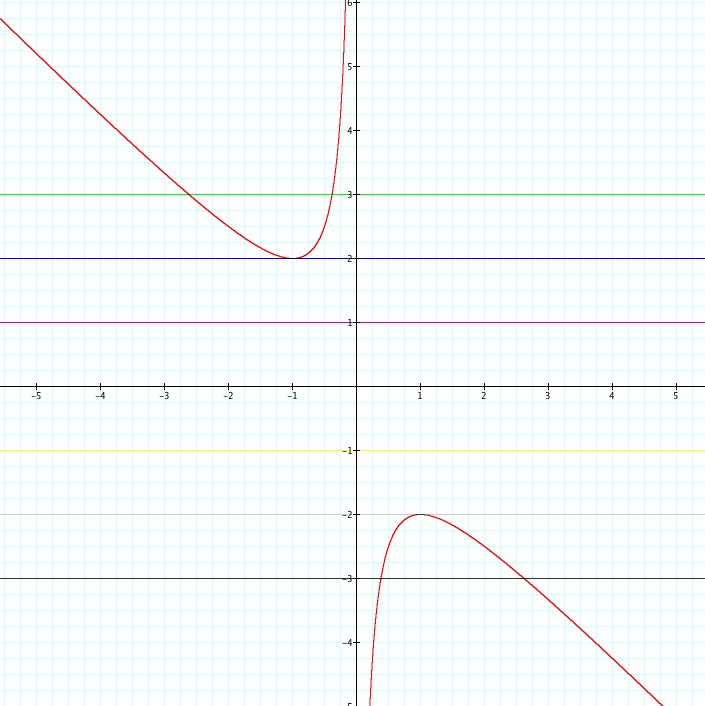
From the y = - ((1+ x^2)/x) graph we can notice a couple of things right off the bat. First the graph is a hyperbola. Second, we have an asymptote at x = 0. A graph was not necessary to figure this out for we can see that our equation is undefined at x = 0. If you were expecting the graph y= - ((1+ x^2)/x) to look similarly to the graph y = x^2 + bx + 1 remember to graph an equation in the xb plane we must rewrite and solve the equation for the coefficient b. Thus, we will be separating the coefficient b from the term x which implies division and consequently we will have a term in the denominator. Since we know the denominator cannot equal zero our graph will have an asymptote where the graph is undefined i.e. where the denominator would equal zero.
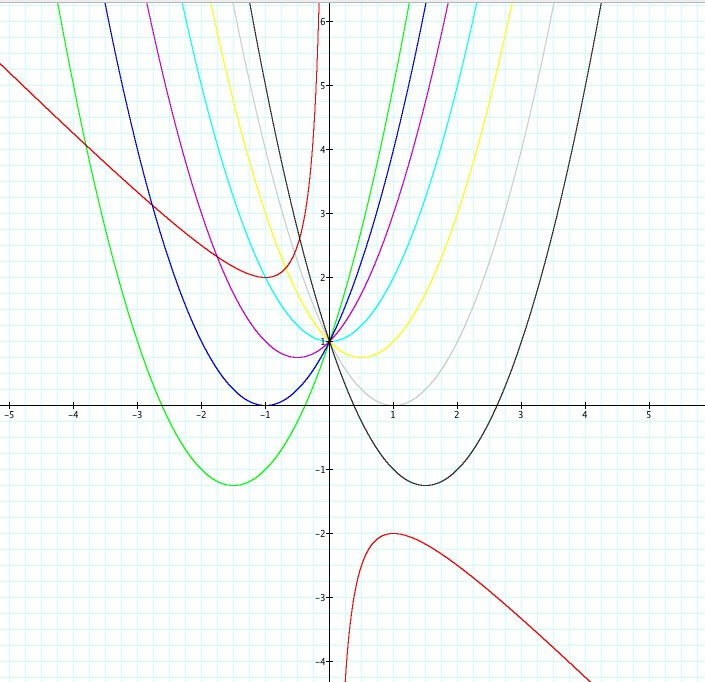
Looking above we see that our graph y = - ((1+ x^2)/x) is intercepted by the horizontal lines where b (remember b = y) is greater than or equal to 2 and where b is less than or equal to -2. When y = -2 and 2 we have only one intersection, but beyond those points following the inequality we have the line b = a is intersects the equation in two places. Is there a correlation between these intersection points and the roots of the equation y = x^2 + bx + 1? Lets take a closer look. When b = 2 we have a parabola y = x^2 + 2x + 1 and the graph has one root at x = -1 which is also the vertex of the parabola. Now, in our graph y = - ((1+ x^2)/x) when b = 2 we have one root at x = -1 which also corresponds to the vertex. But notice when b = 1 we have no x intercepts in either graph, therefore, there are no roots. In conclusion, if the line b = a, where a ∈ R, intersects the graph y = - ((1+ x^2)/x) then those points correspond to the roots of the graph y = x^2 + bx + 1.
This makes sense because y = - ((1+ x^2)/x) is just the graph y = x^2 + bx + 1 graphed in the xb plane which was discussed above.
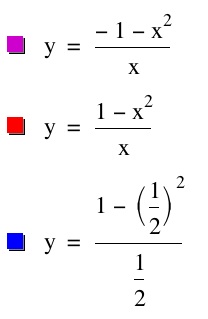
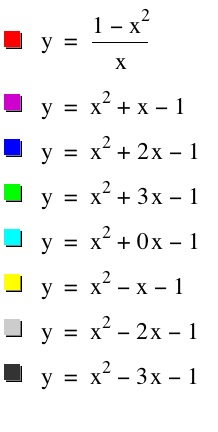
To further our exploration we will now consider the case when c = -1 rather than + 1.
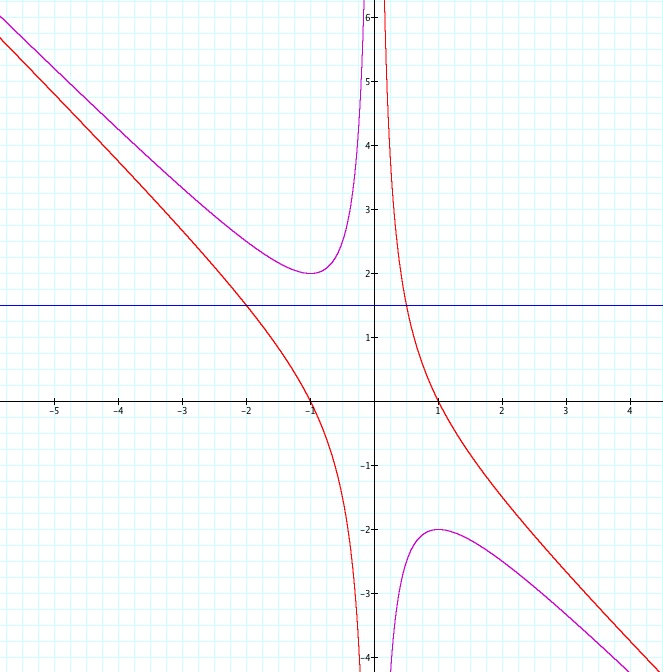
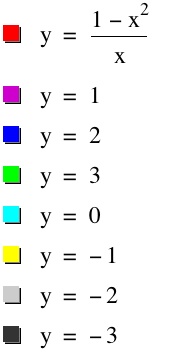
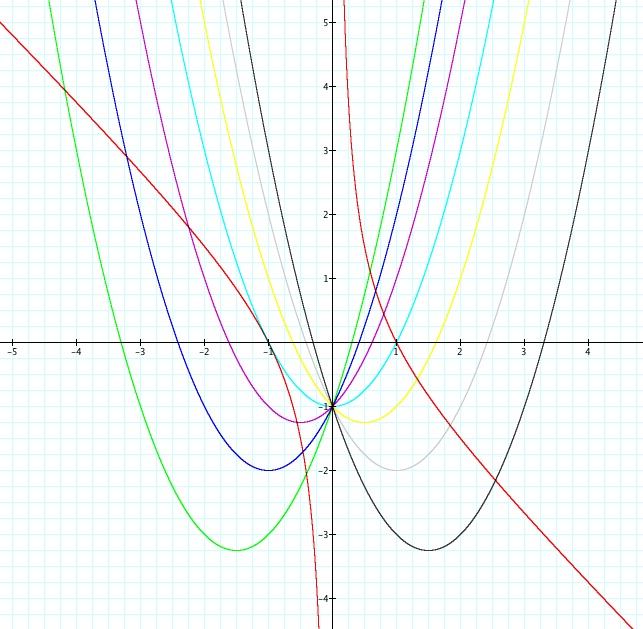
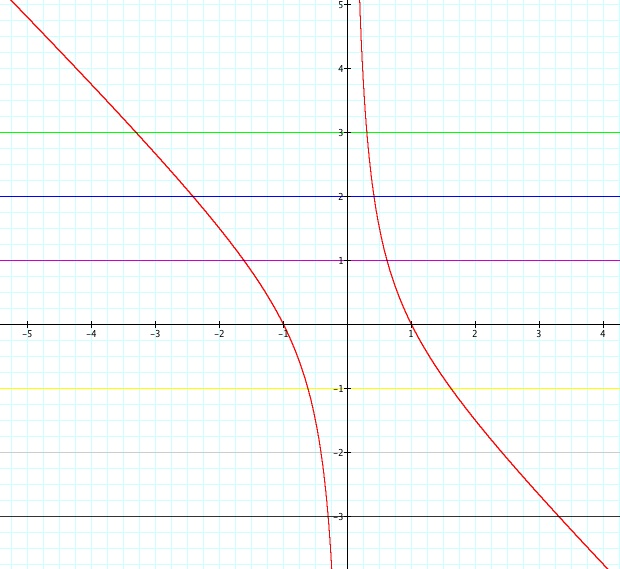
We can see that our graph remains a hyperbola regardless of the sign of c. However, this time the hyperbola is now passing through x = -1 and x = 1. Why has this happened? And how has it effected the relationship between the hyperbola's roots and the parabola's vertex? When we changed the sign of c to be negative we removed the root and intersection limitations like we had when c = +1. Our hyperbola still has a limit at x = 0, but take a closer look at the blue line below where x = 1/2. This line intersects our new hyperbola in two places and it does not intersect the red hyperbola where c = +1. If we were to adjust the value of x the line would move up and down the y-axis, which implies that our line will always intersect our hyperbola y = ((1 - x^2)/x). From what we discovered above we now can see that these intersections correspond to the roots of of the parabola.
Unlike our first set of parabolas where c = +1, when c = -1 our parabolas always intersect the the x-axis in two places. Therefore, there will always be two roots and this follows our observations above of our lines always intersecting the hyperbola when c= -1. Again, where the parabola intersects the x-axis those correspond to the x values of the intersection between the horizontal line and the hyperbola.
In conclusion, this exploration shows the effects of changing the sign of the term c in the xb plane. Furthermore, we can see the correlation between hyperbolas, parabolas, and the lines b = a. Where b = y in the xb plane and a is a varying real number. This correlation helps us understand the shape and limits of the hyperbolas, for the minor change of the sign of c created a much larger, different resulting hyperbola. We can see without plugging individual values in for x and y into our equations that the hyperbola y = - ((1+ x^2)/x) and y = ((1- x^2)/x) have different ranges and domains. All values of x and y lie on the hyperbola y = ((1- x^2)/x) except for x = 0. This is incredibly interesting for the hyperbola y = - ((1+ x^2)/x) which has c = +1 will not be contain values such that -2 < b < 2. So not only have we discovered the large effects of a simple sign change, but we have also discovered the correlations between parabolas, hyperbolas, and the line b = a in the xb plane!
CLICK HERE TO RETURN TO MY HOME PAGE