
Last modified on February 1, 2016.
For each of the following items, use a graphing program, such as Graphing Calculator 3.5, GC 4.0, or GC Lite or other software, to explore, understand, and extend. Some these explorations would be tedious with a function grapher (such as found on most hand-held graphing calculators) but you may want to consider the problems or modifications of the problems for function grapher (y = f(x)) devices.
Investigate ALL of the problems. You may want to prepare a file of discussion, summary, or graphs to illustrate what you have found on some of the problems.
SELECT ONE PROBLEM TO WRITE UP AND POST TO YOUR WEB PAGE AS HOMEWORK. The write-up should deal with the underlying mathematics of the problem and not just be a collections of graphs from using the technology. The idea is to use the technology and what you glean from the exploration to communicate the mathematical ideas.
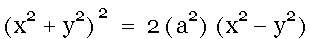
1. Examine the equation:
. Here are some things to do to "examine" the equation.
A. See the graph.
B. What happens if the 4 is replaced by other numbers (not necessarily integers)?
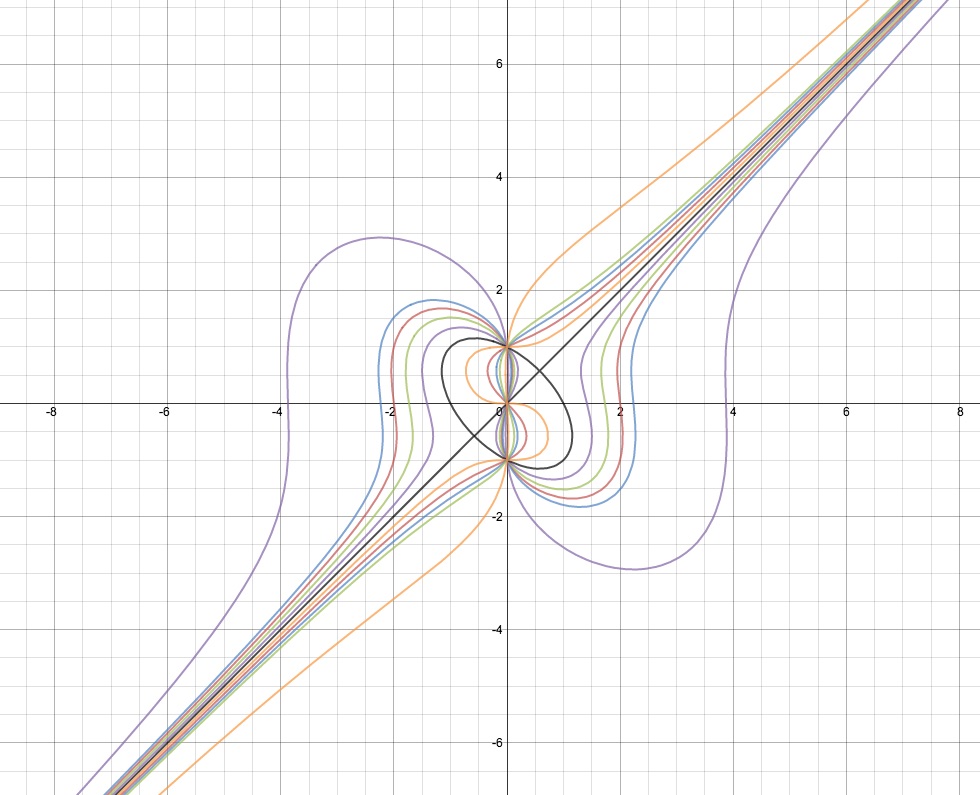
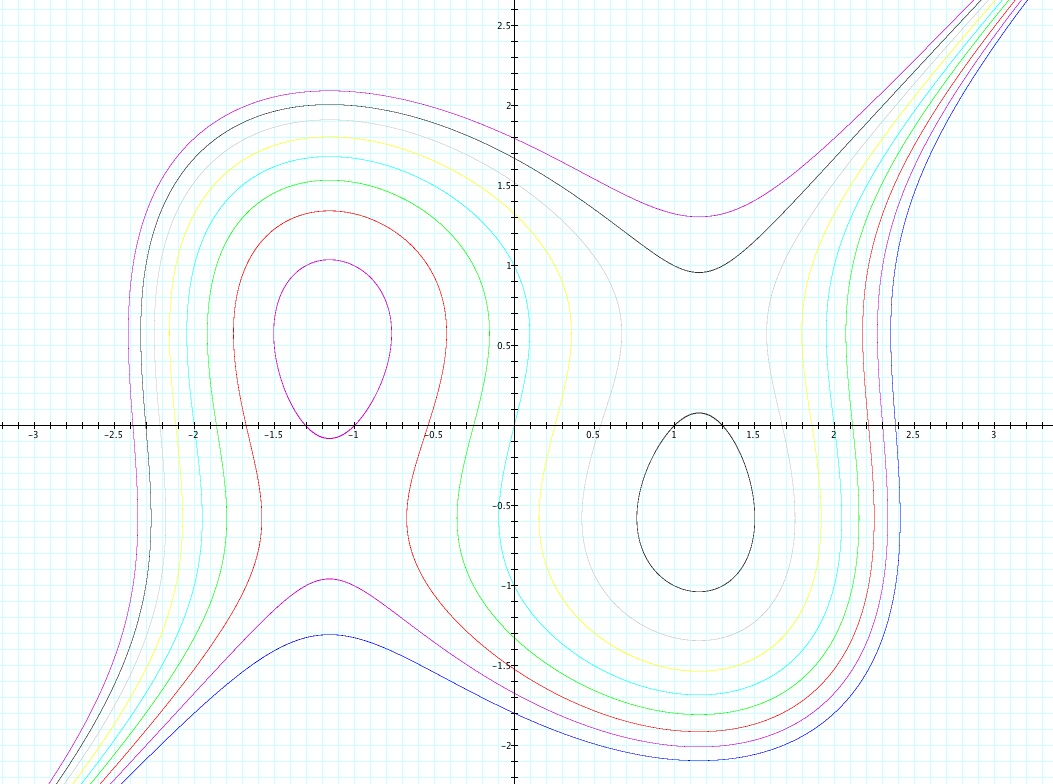
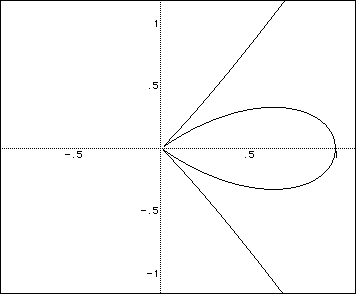
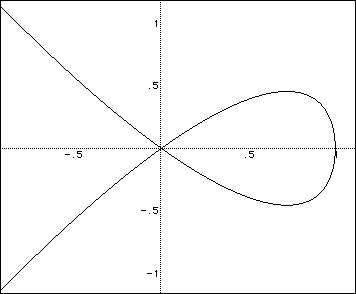
Try 5, 3, 2, 1, 1.1, 0.9, -3. Click HERE. Click HERE.C. Any unusual event? Click HERE. Interpret. See Extension
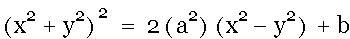
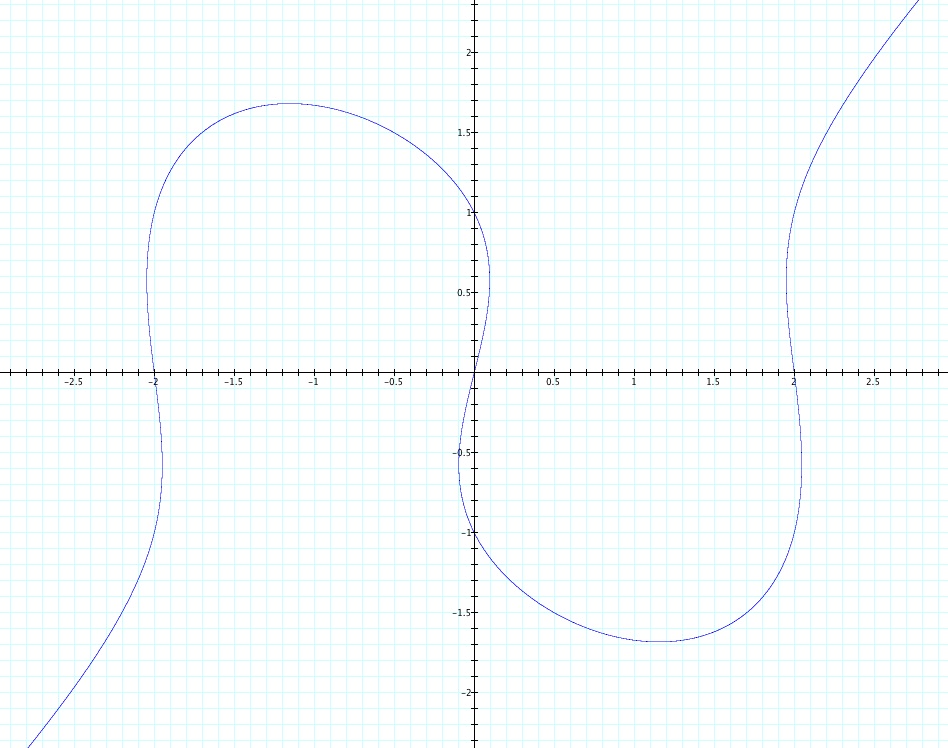
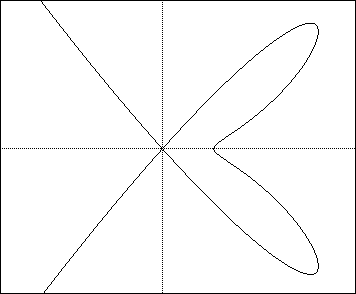
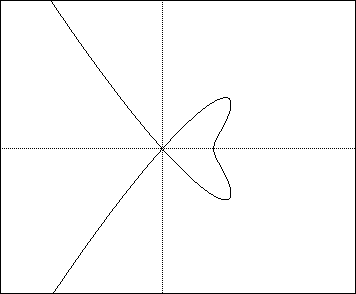
D. What equation would give the graph at the right?
(The answer might be found in part E below.)
E. What happens if a constant is added to one side of the equation? For example, what do you expect to change with a constant of 1 added to the right hand side of the equation? Try several graphs in some systematic way. Click HERE for one set of graphs.
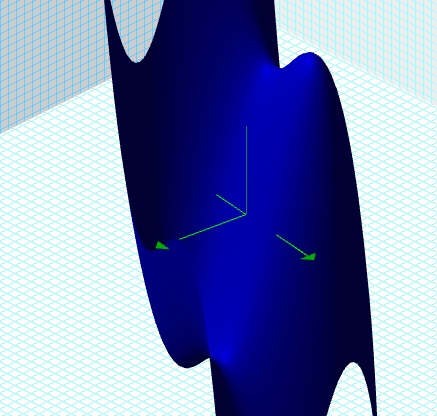
F. Use Graphing Calculator to create a graph of a 3-D surface with the equation:
You may have to zoom in or out to get the image acceptable.
Click here to see another Graph.
NOTE: WHEN THE WORD "EXAMINE" IS USED IN THIS COURSE, THERE IS AN EXPECTATION OF RATHER THOROUGH INVESTIGATIONS.
2. Make up linear functions f(x) and g(x).
Explore, with different pairs of f(x) and g(x) the graphs for
Summarize, explain, and illustrate.
3. Find two linear functions f(x) and g(x) such that their product
is tangent to each of f(x) and g(x) at two distinct points. Discuss and illustrate the method and the results.
Do you want to see someone else's discussion of this? If so click here.
4. Repeat Problem # 3 above where f(x) and g(x) are quadratic functions and each function, f(x) and g(x) is tangent to h(x) in two different points. That is, h(x) is a fourth degree equation and each of the second degree equations, f(x) and g(x) is tangent to h(x) in two points.
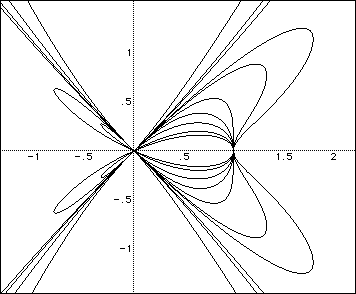
5. Examine graphs of y = a sin(bx + c) for different values of a, b, and c.Provide a mathematical interpretation of the Parameters a, b, and c.
Explore using animations to illustrate the impact of each parameter.
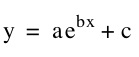
6. Examine graphs of
for different values of a, b, and c. Graphing Calculator reserves the use of the symbol e.
7. Examine Graphing Calculator 3.5 graphs of
y = ln x
y = log x
Evaluate ln e and log 10. Also consider various values of a and b for
y = a (ln x)
y = ln (bx)
y = a (log x)
y = log (bx)
8. Using Graphing Calculator 3.5 or 4.0, graph
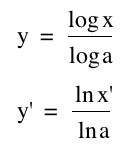
for various values of a, including a = 2, 3, e, 5, and 10. (Note: the prime notation will allow GC 3.5 or 4.0 to show graphs side-by-side.)
9. Graph
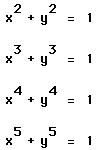
What do you expect for the graph of
or
Is there anything more that can be done with this investigation?
Did you give an adequate mathematical interpretation of what was observed in the pictures?
What if the exponents are negative?
What about exponents between 0 and 2 ? Graph the powers of the absolute values of x and y.
10. Let f(x) = a sin(bx + c) and g(x) = a cos(bx + c).
For selected values of a, b, and c, graph and explore:
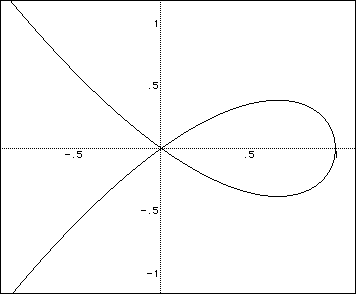
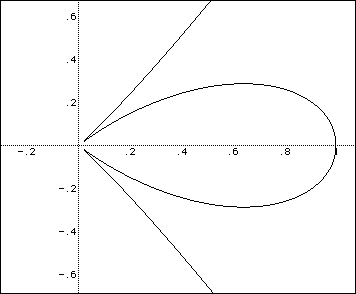
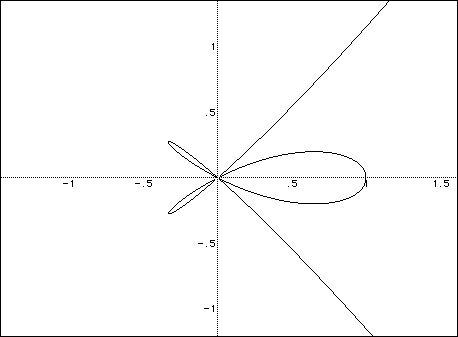
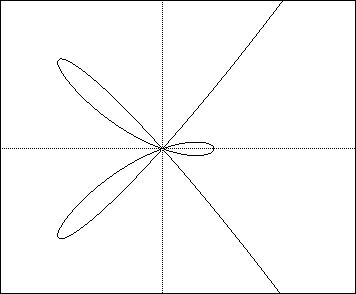
11. Graph the equation
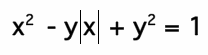
where |x| is the absolute value of x. Variations?
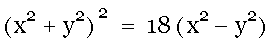
12. Explore the equation at the right for different values of a.
Some examples: (These are all links and each should open a graph).
| a = 0 | | a = 1 | | a = 3 | | a = 5 | | a = 10 |
| a = -10 | | a = -3 | | a = -5 | | a = .10 |
| a = .50 | | a = -.50 | | a = -.10 |
| Multiple Graphs |
13. Consider two points (3,4) and (-5,-2). For any point (x,y) we can write the distance equations for these as given at the right. For the cases below, explore graphs using these two distance equations.
For example,
a. Consider when each is set to a positive constant. Circles are graphed. If the constant is very small, your graph can appear to indicate the locations of the points in the Cartesian plane.
b. Consider the sum
for various positive values of S. The set of points for which the sum of the distances from two fixed points is the locus of an ellipse, where the two fixed points are the foci of the ellipse.
What is the minimum value for S?
c. Consider the product
for various values of P. Curves for three values of P are displayed at the right. When P approaches 0, the "curve" approaches the two focal points. What happens as P gets larger? What is the value of P that results in the red curve?
d. Consider the difference of the two. Either graph the absolute value of the difference or simultaneously graph two equations for plus or minus the difference constant.
Recall: The locus of a point that is a constant difference from two fixed points is the hyperbola.
e. Consider the quotient of the two distances for a constant that ranges from 0 to 5. Compare when the constant is less than 1, equal to 1, and more than 1.
14. When the graph of the product of two distance equations forms two loops connected to a single point, the lemniscate of Bernoulli is formed. If the two given points are (-a, 0) and (a,0) then the lemniscate has its center at the origin (0,0) and major axis along the x-axis.
For example, let a = 3. Then
will be the lemniscate at the right.
a. Show that the equation can be simplified to
b. In general, if the foci of the lemniscate are (-a, 0) and (a, 0) then the equation in Cartesian coordinates is
Try graphs for different values of a.
c. Graph this equation
for different values of a and b.
d. Translate
into an equation in polar coordinates.
e. Other?
More about LemniscatesNote: Later, we may have opportunity to examine lemniscates developed from geometric considertations. For example
-- a lemniscate can be formed by the envelope of circles with center moving along the hyperbola, all passing through a fixed point
-- a lemniscatge is an image of the hyperbola transformed by inversion into a circle with respect to the center of the hyperbola.