
In the insvestigations so far, we began with an equation and found parameters that created nodes in the graph. These nodes indicated possible factorable expressions, such as
The original graph of
did not have nodes.
Changing the "4" parameter to "1" produced an equation where the expression was easily factorable.
New Direction
Think about REVERSING this investigative process. That is, BEGIN with a graph containing nodes (perhaps created with curves you can readily identify) and then explore the resulting equations and graphs when parameters are changed. Let's starte with something very simple:
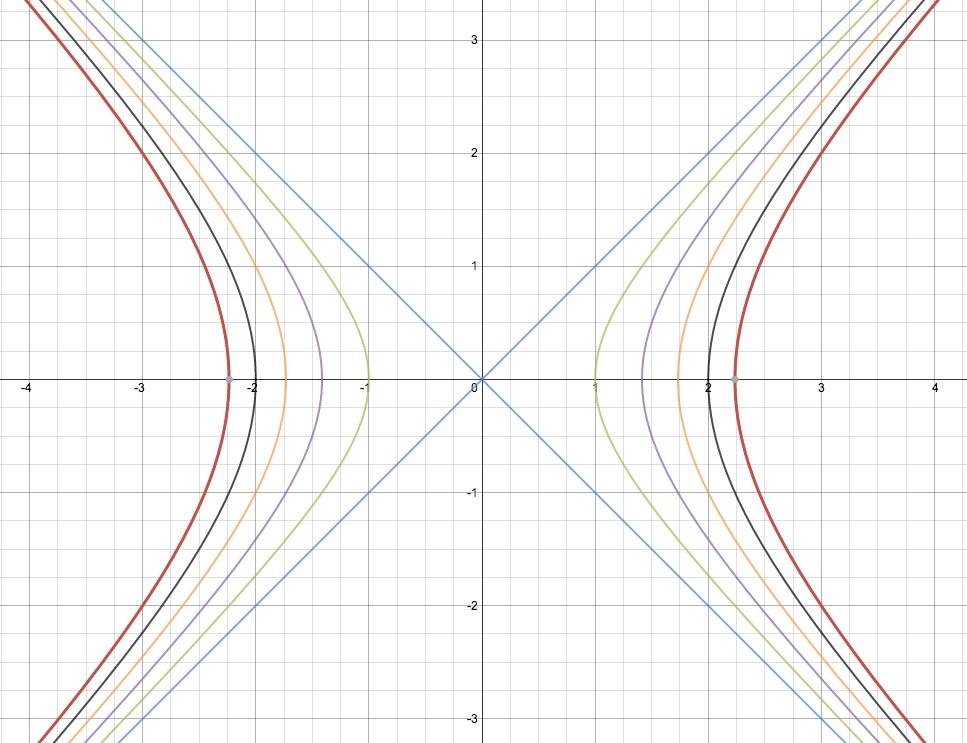
Two lines that cross. Take (x - y)(x + y) = 0. The graph is two lines with slopes of 1 and - 1 that cross at (0,0). (Note that by multiplying the "lines" we have a single equation that gives us this graph.)
The only "parameter" in this equation is the "0" on the right hand side. Examine what happens if we consider different values for that parameter. CREATE your own. Or, click HERE. Or HERE. or HERE.
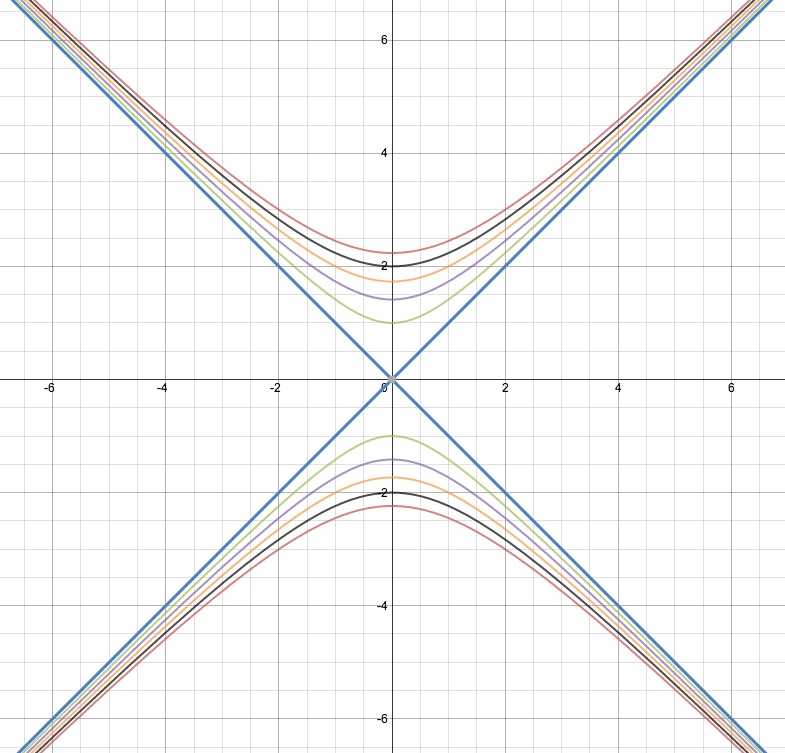
Creating an interesting picture may not be the end result mathematically. In this case, for example, the picture demands an explanation or proof why the graphs that result for the different values of the parameter are hyperbola, all having the same asymptotes that are in the original equation.
Suggestion: Try this approach beginning with THREE lines. A simple case would be (x - y)(x + y)(y - 3) = 0