
Last modified May 20, 2012
Explore ALL problems of Assignment 2. Then, select one problem from Assignment 2 and prepare a Write-up. Remember that you are discussing the mathematics, not just the pictures.
1. Examine graphs for the parabola
![]()
for different values of a, b, and c. (a, b, c can be any rational numbers).
Try using the GC 3.5 or 4.0 animation by replacing a, b, or c with an n and selecting an appropriate range for n.
2. Fix the values for b and c, vary a. Make at least 5 graphs on the same axes as you vary a. For example,
Varying a from - 4 to 4 for integer valuesTry an animation for the same range.
What happens to
(i.e., the case where b=1 and c=2) as a is varied?
Is there a common point to all graphs? What is it?
What is the significance of the graph where a = 0?
Do similar interpretations for other sets of graphs.
How does the shape change? How does the position change?
2. Fix the values for a and b, vary c. Make at least 5 graphs on the same axes as you vary c. For example,
Varying c from - 4 to 4 for integer values.
Try an animation for the same range.
What is happening mathematicatically?
Can you prove this is a translation and that the shape of the parabola does not change?
4. Graph the parabola
i. Overlay a new graph replacing each x by (x - 4).
ii. Change the equation to move the vertex of the graph into the second quadrant.
iii. Change the equation to produce a graph concave down that shares the same vertex.iv. Generalize . . .
5. Try several graphs of
on the same axes. (i.e., use different values of a)
6. Produce several ( 5 to 10) graphs of
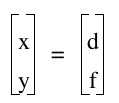
on the same axes using different values for d and f. Does varying d change the shape of the graph? the position? Does varying f change the shape or position of the graph?
Plot the points (d, f) on your graphs using
This is the GC 3.5/4.0 "2-vector" input and is essentially a parametric equation for a point.
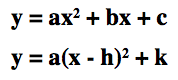
7. Show the relationship between the two standard forms of the graph of a parabola:
A write-up should show the derivation of one equation from the other AND an interpretation/rationale for the value of parameters a, b, c, h, and k.
8. Graph
Now, on the same axes, graph
Describe the new graph. Try different coeffcients for the xy term. What kinds of graphs do you generate? What coefficients mark the boundaries between the different types of graphs? How do we know these are the boundaries? Describe what happens to the graph when the coefficient of the xy term is close to the boundaries.
Did you find this?
Or,what about this?
Or, try this one.
Return
to EMAT 6680 Home Page