Last modified on August 20, 2012
This exploration is to concentrate on PATTERNS of roots for quadratic equations. It is less about "finding" roots. The secondary school mathematics curriculum puts a lot of emphasis on procedures for finding roots and proficiency in using these procedures. Here, we are less concerned with root finding procedures and look instead to the how the patterns for those roots are related to the values of the parameters, a, b, and c, in the quadratic equation.
Study the background information. Then examine the investigations and select something from one or more of the investigations for an Assignment 3 write-up.
Background
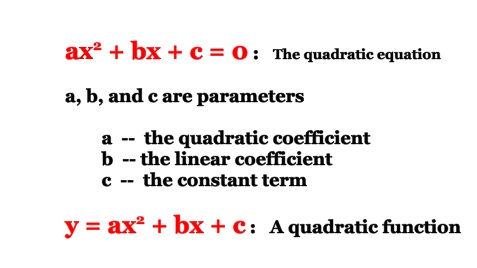
The quadratic equation has an extensive place in mathematics discourse and takes up a significant part of the secondary school curriculum. Most of our attention and practice, however, is given over to finding roots. That is, for what values of the variable x is the quadratic function equal to 0?
The PATTERNS, however, may come out of examining the graphs of the quadratic function for different values of a, b, and c.
In Assignment 2, Exploration 2, for instance, you examined several graphs of the quadratic function on the same axes where a = 1, b = 1, and the graphs were for different values of c.
Several things could be observed from this:
Each graph crosses the y-axis for that particular value of c.
Changing c produces a vertical shift in the graphs.
Each graph intersects the x-axis in 2 places, 1 place, or 0 places.
There are at most two real roots. There can be 0 or 1 real root.
A similar investigation was done with Assignment 2, Exploration for b = 1, c = 1, and different graphs for a.
If we set a = 1 and c = 1 and overlay many graphs of
for b = -3, -2, -1, 0, 1, 2, 3, the picture is obtained.
We can discuss the "movement" of a parabola as b is changed. The parabola always passes through the same point on the y-axis ( the point (0,1) with this equation). For b < -2 the parabola will intersect the x-axis in two points with positive x values (i.e. the original equation will have two real roots, both positive). For b = -2, the parabola is tangent to the x-axis and so the original equation has one real and positive root at the point of tangency. For -2 < b < 2, the parabola does not intersect the x-axis -- the original equation has no real roots. Similarly for b = 2 the parabola is tangent to the x-axis (one real negative root) and for b > 2, the parabola intersets the x-axis twice to show two negative real roots for each b.
Now consider the locus of the vertices of the set of parabolas graphed from
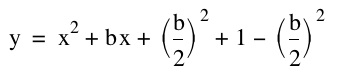
Without calculus, show that the locus is a parabola. One approach is suggested by Item 6 in Assignment 2. If we complete the square with first two terms on the right hand side of the equation we get
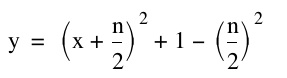
Factoring, and replacing b by n for purposes of animating a graph we have
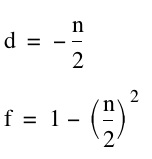
The point (d,f) is the vertex of each parabola where
That is, the parabolas are in the form
. Now, (d, f) is the vertex of a parabola corresponding to any n. Set x = d and y = f and solve each for n. Set these two expressions for n equal to one another and the resulting equation is
Here is a Graphing Calculator animation:
Investigation 1.
Graphs in the xb plane.
Consider again the equation
Now graph this relation in the xb plane. We get this graph.
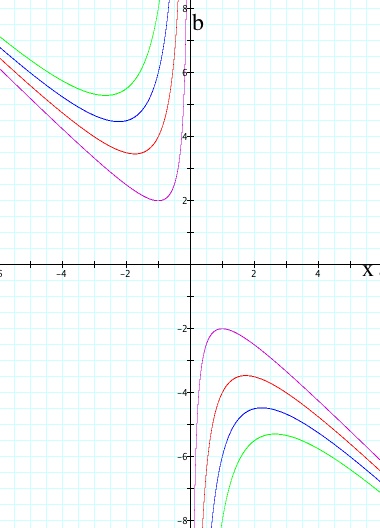
Similarly we can overlay multiple graphs for the constant term, c.
Here we have graphs for c = 1, 3, 5, or 7.
If we take any particular value of b, say b = 5, and overlay this equation on the graph we add a line parallel to the x-axis. If it intersects the curve in the xb plane the intersection points correspond to the roots of the original equation for that value of b. We have the following graph.
For each value of b we select, we get a horizontal line. It is clear on a single graph that we get two negative real roots of the original equation when b > 2, one negative real root when b = 2, no real roots for -2 < b < 2, One positive real root when b = -2, and two positive real roots when b < -2.
Consider the case when c = - 1 rather than + 1.
Graph other values of c on the same axes.
We have a family of hyperbolas.
The equation for c = 0 will yield the asymptotes, x = -b and x = 0
Each horizontal line representing a value of b will cross each hyperbola 0, 1, or 2 times.
Investigation 2.
Add the graph of 2x + b = 0 to the picture and discuss its relation to the quadratic formula.
The intersection of any horizontal line with 2x + b will occur a a point midway between the two intersections with each of the hyperbolas.
Investigation 3.
Consider graphs in the xc plane.
Investigation 4.
Consider graphs in the xa plane
Investigation 5.
Consider the equation
Explore the pattern of roots in the xb, xc, or xd planes. (Okay, maybe look at the xa plane too!)
Return to EMAT
6680 Home Page