THE ASSIGNMENT:
As you can see below, I am responsible for altering this possible article written by Dr. Jim Wilson so that it will be presentable in a publication.
It has now become a rather standard exercise, with availble
technology, to construct graphs to consider the equation
and to overlay several graphs of
for different values of a, b, or c as the other two are held constant. From these graphs discussion of the patterns for the roots of
can be followed. For example, if we set
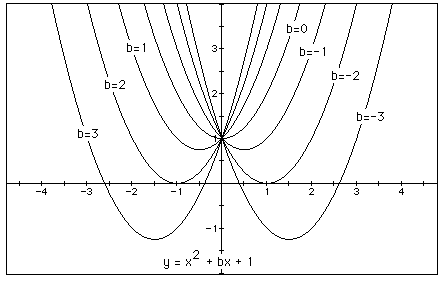
for b = -3, -2, -1, 0, 1, 2, 3, and overlay the graphs, the
following picture is obtained.

We can discuss the "movement" of a parabola as b
is changed. The parabola always passes through the same point
on the y-axis ( the point (0,1) with this equation). For b <
-2 the parabola will intersect the x-axis in two points with positive
x values (i.e. the original equation will have two real roots,
both positive). For b = -2, the parabola is tangent to the x-axis
and so the original equation has one real and positive root at
the point of tangency. For -2 < b < 2, the parabola does
not intersect the x-axis -- the original equation has no real
roots. Similarly for b = 2 the parabola is tangent to the x-axis
(one real negative root) and for b > 2, the parabola intersets
the x-axis twice to show two negative real roots for each b.
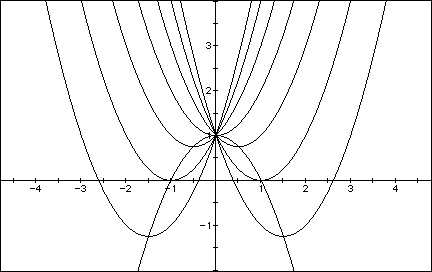
Now consider the locus of the vertices of the set of parabolas
graphed from
Show that the locus is the parabola
Generalize. It
should become apparent to the students that the locus of the vertices
forms a parabola that opens downward.

Consider again the equation
Now graph this relation in the xb plane. We get the following
graph.

If we take any particular value of b, say b = 3, and overlay
this equation on the graph we add a line parallel to the x-axis.
If it intersects the curve in the xb plane the intersection points
correspond to the roots of the original equation for that value
of b. We have the following graph.

For each value of b we select, we get a horizontal line. It is clear on a single graph that we get two negative real roots of the original equation when b > 2, one negative real root when b = 2, no real roots for -2 < b < 2, One positive real root when b = -2, and two positive real roots when b < -2. One aspect of mathematics that students often fail to grasp it the concept of roots. By using this visual representation of roots it should enable students to gain a better understanding of why different types (negative and positive) and different numbers (i.e. 2, 1, 0) of real roots are possible.
Consider the case when c = - 1 rather than + 1.

In this case there will always be two roots, one positive and one negative. This can be seen by looking at any line b=n. In every case the line b will cross the graph at two points which mark the roots of the graph at that point.
In the following example the equation
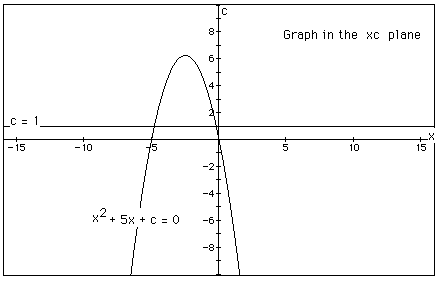
is considered. If the equation is graphed in the xc plane,
it is easy to see that the curve will be a parabola. For each
value of c considered, its graph will be a line crossing the parabola
in 0, 1, or 2 points -- the intersections being at the roots of
the orignal equation at that value of c. In the graph, the graph
of c = 1 is shown. The equation
will have two negative roots -- approximately -0.2 and -4.8.

There is one value of c where the equation will have only 1
real root -- at c = 6.25. For c > 6.25 the equation will have
no real roots and for c < 6.25 the equation will have two roots,
both negative for 0 < c < 6.25, one negative and one 0 when
c = 0 and one negative and one positive when c < 0.
Conclusion:
Although I have not added much information to this write-up I feel that it is important for the graphic awareness of real roots to be stressed to students. This implies that teachers must be aware of the possibilities that using technology to quickly graph functions will provide for their students. Too often students are taught to derive real roots without an understanding of the bearing they have in a visual sense. Also, many students struggle with the notion of real roots when they are being taught to find them without the visual understanding whereas most students are capable of gaining an understanding using this graphical representation.