
Investigating Parametric Curves
by
Kimberly Burrell
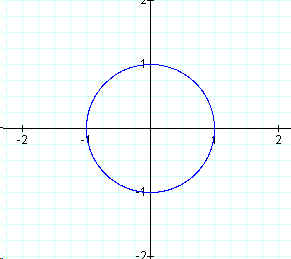
To begin our investiagtion with parametric curves we will first look at the graph of
x = cos (t)
y = sin (t)
for 0 < t < ![]()
In this particular investigation, we will be using the following parametric equations
x = a cos (t)
y = b sin (t)
for 0 < t < ![]() and varying
"a" and "b".
and varying
"a" and "b".
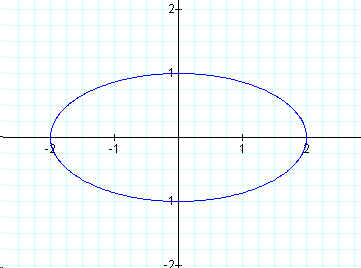
First we will vary "a" to see the effects that it has on the graph. The graph below if for
x = 2 cos (t)
y = b sin (t)
for 0 < t < ![]() .
.
One can now compare that to graph of
x = 5 cos (t)
y = b sin (t)
for 0 < t < ![]() .
.

The effects that "a" has on the cosine function seems to appear to stretch the graph along the x-axis. It appears that as "a" becomes larger the graph has a greater stretch to it.
How will the graph change if we vary "b" which is in the sine function?
In the following graph we will use 2 and 5 for the values of "b".
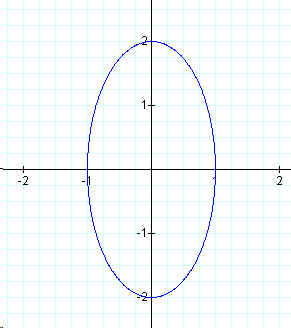
The graph below is for
x = a cos (t)
y = 2 sin (t)
for 0 < t < ![]() .
.
One can now compare that to the graph of
x = a cos (t)
y = 5 sin (t)
for 0 < t < ![]() .
.
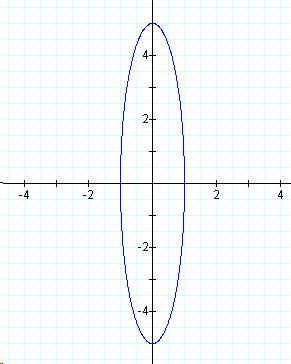
The effects that "b" has on the sine function seems to appear to stretch the graph along the y-axis. It appears that as "b" becomes larger the graph has a greater stretch to it.
How will the graph change if we vary both "a" and "b"?
We will continue to use the values of 2 and 5 for "a" and "b".
First, we will use the same value for both "a" and "b". The following graph shows the illustration when 2 is used (blue) and when 5 is used (red).
x = a cos (t)
y = b sin (t)
for 0 < t < ![]() .
.
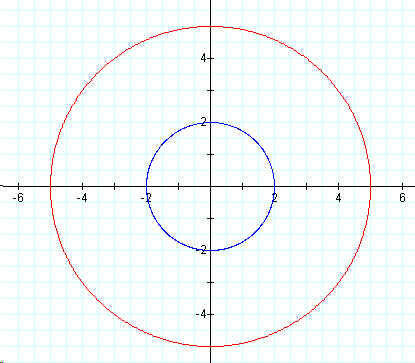
It appears that when the variables of "a" and "b" are the same, then we have a circle graph.
Now we will allow "a" = 2 and "b" = 5 for the blue graph and "a" =5 and "b" = 2 for the red graph.
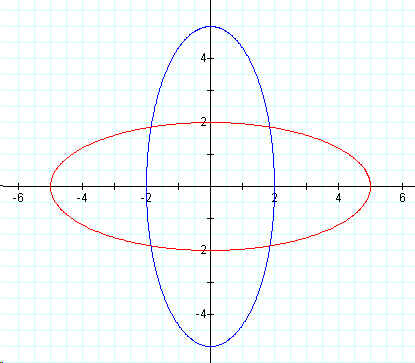
From this one can observe the graph appears to be an ellipse. The stretch is greater on the axis that corresponds with the value of 5. The graph is also wider than the original graph because of the value of 2.
CONCLUSION
The following assumptions can be made based upon our investigation.
If a > b, then the curve is an ellipse with horizontal major axis.
If a < b, then the curve is an ellipse with a vertical major axis.
If a = b, then the curve is a circle with a radius equal to a (or b).