
| This is the write-up of Assignment #1 |
Brian R. Lawler
|
| EMAT 6680 |
12/04/00
|
The Problem
Let f(x) = a sin(bx + c) and g(x) = a cos(bx + c). For selected values of a, b, and c, graph and explore:
|
i.
|
h(x) = f(x) + g(x) |
|
ii.
|
h(x) = f(x).g(x) |
|
iii.
|
h(x) = f(x)/g(x) |
|
iv.
|
h(x) = f(g(x)) |
Analysis
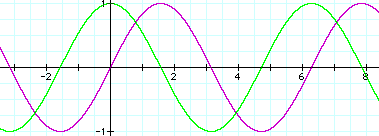
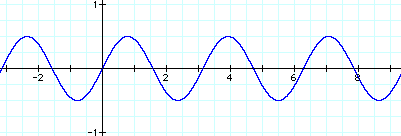
I decided to use Graphing Calculator to explore this problem. I first graphed y = a sin(bx + c) and y = a COs(bx + c) hoping to reacquaint myself with the affects the parameters a, b, and c had on the sine and cosine graphs. The initial graph set a = 1, b= 1, and c= 0. Here is what I saw:
|
|
|
|
|
(Note that if you click on the graph image above, you will download the .gcf file to allow you to explore and manipulate the file yourself. I will maintain this ability throughout the work below.)
Most obviously, the two functions appear identical, other than a horizontal shift. To investigate, I began by adjusting a. This caused the two functions to stretch vertically together. As I adjusted b, the two functions stretched horizontally together. And I found that as c changes, the two functions would slide horizontally together. This confirmed for me that the two functions behaved identically as these particular parameters changed.
As I adjusted values of a, b, and c, I recalled that a affects the amplitude of the graphs. Namely, the amplitude = a (recall amplitude is the distance from the horizontal line of symmetry to the function maximum, or minimum).
b affects the period of these functions. The period refers to the horizontal distance (or domain, if you will) at which the function repeats. In the standard graphs above, this period is 2pi. Generally, 2pi /b gives the period of equations of this form.
The horizontal shift, or "phase shift", however, is not so immediately discerned. The fraction c/b describes the amount of shift to the left of the standard graphs above. Notice this example has a phase shift of 0 since c = 0.
Part i:
Now I was ready to consider the function defined by the sum of f(x) and g(x), namely h(x) = f(x) + g(x). The function h(x), with a = 1, b= 1, and c= 0, looks like:
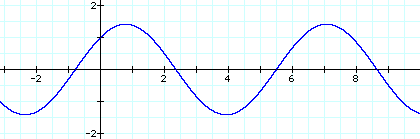 |
The graph of h(x) sure appears the same! (other than being blue) This function is still cyclic with smooth waves. Again, the period remains 2pi /b which = 2pi in the case above. However, the amplitude has changed. It is a bit taller. There is also a horizontal shift: to the right of the sine equation and to the left of the cosine.
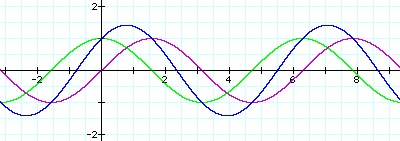
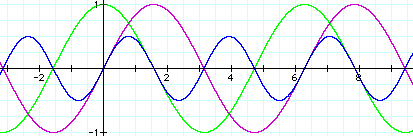
To help see the reason for these effects, I looked at the graph of all three functions f(x), g(x), and h(x). Observe the peaks of h(x) occur midway between the peaks of the other two functions. This also appears to be the x-values at which f(x) = g(x). When the y-values are positive, the graphs suggest that the amplitude is twice the value of either function at that particular x-value. The period remains the same because this sum is tied to the period of the original functions, which are equal to each other and equal to c/b.
| f(x) | |
| g(x) | |
| h(x) | |
 |
a = 1 b = 1 c = 0 |
 |
a = 2 b = 3 c = -4 |
From an algebraic standpoint, by first noticing that
,
it follows that
.
From this equation, it is evident that the amplitude becomes ![]() and the phase shift is
and the phase shift is ![]() .
.
Furthermore, there is no change in the coefficient of x, and thus the period remains 2pi/b.
Part ii.
Next I considered the function defined by the product of f(x) and g(x), namely h(x) = f(x) * g(x). The function h(x), with a = 1, b= 1, and c= 0, looks like:
 |
The graph of h(x) sure appears very similar once again, of course other than being blue! This function is still cyclic with smooth waves. This time there appears to be no horizontal shift when compared to the sine graph. However, the period appears to be cut in half, in other words equal to pi /b which = pi in the case above. Furthermore, the amplitude has changed. It is shorter - perhaps by half?
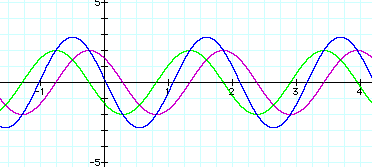
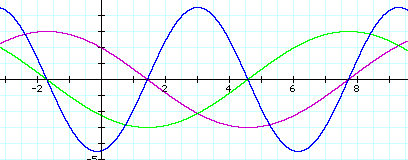
To help see the reason for these effects, I looked at the graph of all three functions f(x), g(x), and h(x). Observe the peaks of h(x) occur midway between the peaks of the other two functions. This also appears to be the x-values at which f(x) = g(x), as it did in i. above. But additionally, another peak occurs when the functions attain a range value exactly opposite the other, i.e. when f(x) = -g(x). This double frequency of the maximums and minimums justifies the period being cut in half.
The reasons for the effects on amplitude and phase shift did not seem so obvious when observing the graphs. Click here to view a Quicktime movie to observe changing values of a.
| f(x) | |
| g(x) | |
| h(x) | |
 |
a = 1 b = 1 c = 0 |
 |
a = -3 b = .5 c = -7 |
Some of these observations may be confirmed from a purely symbolic perspective.
Rewriting h(x) yields![]() .
(This was simplified on my TI-89 calculator.)
.
(This was simplified on my TI-89 calculator.)
By observing the coefficients of this equation, it is evident the amplitude
is now ![]() .
This does confirm the conjecture that it may be half, but only when a
= 1. Again, this behavior can be observed in the animation
of a available here.
.
This does confirm the conjecture that it may be half, but only when a
= 1. Again, this behavior can be observed in the animation
of a available here.
The period, which is 2pi divided by the coefficient of the x variable,
is now pi / b, as our conjectures above suggested. And the horizontal
phase shift, when the input to the sine function equals zero, is ![]() ,
as in the original functions.
,
as in the original functions.
Part iii. (continued on next page)
 |
Comments? Questions? e-mail me at blawler@coe.uga.edu |
| Last revised: December 28, 2000 |
|