
| This is the write-up of Assignment #1 |
Brian R. Lawler
|
| EMAT 6680 |
12/04/00
|
Analysis (continued)
Part iii.
Next I considered the function defined by the quotient of f(x) and g(x), namely h(x) = f(x) / g(x). The function h(x), with a = 1, b= 1, and c= 0, looks like:
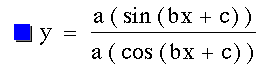 |
 |
The graph of h(x) is now very different. This function is still cyclic, but no longer wavelike. The period appears to be cut in half, similar to the result of graphing the product of f(x) and g(x).
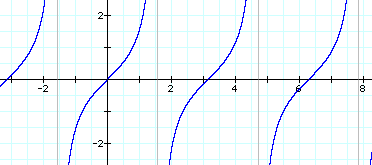
To help investigate the effects of a, b, and c, I looked at the graph of all three functions f(x), g(x), and h(x). Observe in the examples below that h(x) equals zero when f(x) = 0, and that h(x) has a vertical asymptote when g(x) = 0. (Recall, you can click on the graphs themselves to download a graph you can investigate yourself.)
As I adjusted a, this appeared to have no effect on the graph of h(x). Furthermore, b and c appear to stretch and slide as normal.
| f(x) | |
| g(x) | |
 |
h(x) |
 |
a = 1 b = 1 c = 0 |
 |
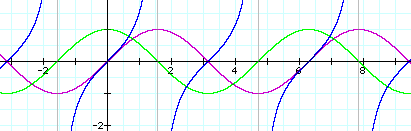
a = 2 b = 3 c = 1 |
These observations may be confirmed from a purely symbolic perspective. Rewriting
h(x) yields ![]() .
The canceling of the coefficient a confirms it's non-role in this quotient.
.
The canceling of the coefficient a confirms it's non-role in this quotient.
Part iv.
In the final phase of my investigation, I considered the function defined by the composition of f(x) and g(x), namely h(x) = f(g(x)). The function h(x), with a = 1, b= 1, and c= 0, looks like:
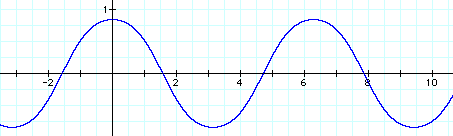 |
The graph of h(x) once again appears cyclic and wavelike. However,
it does "feel" a little different - the waves appear rounder, less
steep between peaks. The period appears to have returned to the standard, 2pi
in this case where b = 1. Also the horizontal phase shift appears to
remain the same, namely ![]() .
.
Again, to aid my investigation of the effects of a, b, and c, I looked at the graph of all three functions f(x), g(x), and h(x). Observe in the examples below that h(x) equals zero if and only if g(x) = 0. Also, x such that f(x) = 0 is always a minimum or maximum for h(x). I believe this observation supports my notions regarding the period and slide remaining the same.
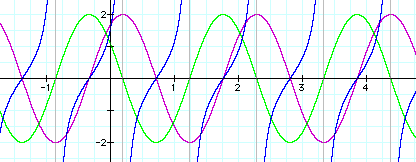
As I adjusted the parameters, many strange behaviors appeared. For example, see the example below with a = 3, b = 1, and c = 1. Click here to observe an animated graph in which c changes.
| f(x) | |
| g(x) | |
| h(x) | |
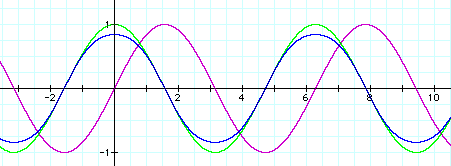 |
a = 1 b = 1 c = 0 |
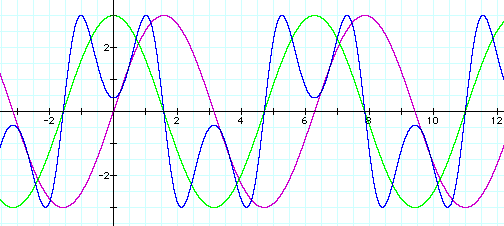 |
a = 3 b = 1 c = 1 |
As I had done in previous problems, I also considered looking at the simplified
symbolic expression of h(x). Rewriting h(x) yields
![]() .
This time I was unable to parse any relevant additional information from this
version of the function.
.
This time I was unable to parse any relevant additional information from this
version of the function.
Conclusions
A quick summary of findings broken down into each part:
|
i.
|
amplitude
|
|
|
|
period
|
2pi/b |
||
|
phase shift
|
|
||
|
ii.
|
amplitude
|
|
|
|
period
|
pi / b |
||
|
phase shift
|
|
||
|
iii.
|
Amplitude
|
--- |
|
|
period
|
2pi/b |
||
|
phase shift
|
|
||
|
iv.
|
Amplitude
|
??? |
|
|
period
|
2pi/b |
||
|
phase shift
|
|
Reflections
I certainly found myself rather engrossed in the power of Graphing Calculator while exploring this problem. Namely, I was amazed by the beauty of many of the graphs and the insight animation of the graphs could provide. In my exploration, many times I would fidget with the coefficients very strenuously seeking verification or counterexamples of my conjectures. I found that I was impressed that I could frequently provide proof of many of my observations through symbolic reasoning. I was equally impressed that I could allow my TI-89 do much of this work. I am motivated to go back through some of the simplification I let the TI-89 do for me and confirm using identities of trigonometry.
Most significantly to me, this investigation gave me an incredible wealth of ideas regarding use of this software in my classroom. I have done various "graphing-free-for-all's" to explore different general functions or more specifically, an exploration of quadratics to conjecture about the affects of it's parameters. While the TI graphing calculators were good tools for this exploration, Graphing Calculator adds several strengths. Firstly is it's ability to animate. Secondly, it's ability to save in various formats is highly conducive to presentations and sharing of ideas. And finally, the color is naturally inviting. I realize there are many additional strengths of the software which I have not yet fully appreciated.
A final mathematical note. I am curious to explore the final example further. What can be said about the period, slide, and shift of this new function? Why do these occur? And finally, and most interesting to me, are the hills that appear and disappear as c changes.
 |
Comments? Questions? e-mail me at blawler@coe.uga.edu |
| Last revised: December 28, 2000 |
|