
A parametric curve is a locus of points whose coordinates are given
as functions of a parameter t.
A parametric curve in the plane is a pair of functions
x = f(t)
y = g(t)
where the two continuous functions define ordered pairs (x,y).
the two equations are usually called the parametric equations of a curve.
The extent of the curve will depend on the range of
t.
Let write the parametric equations of a line that passes through the point (7,5) with slope of 3.
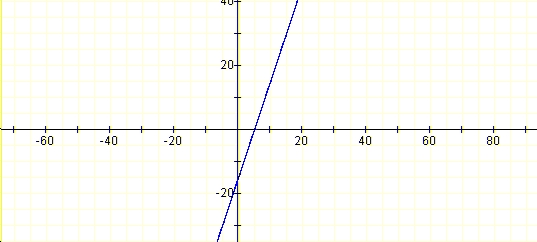
The graph equation of a line that passes through (7,5) with the slope of 3 is a straight line with a domain equal to all real numbers. This equation in slope intercept form will be:
Y= 3x -16
and the graph of the equation is:
The parametric equations of the same line will have this form:
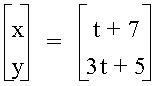
The graph of these equations depends on the range of t.
For t
between 0 and 20, the graph will be:
For t = 0 x = 7 and y = 5
For t = 20 x = 27 and y = 65
APPLICATIONS
Parametric equations are used to solve problems that involve some change
in time, in angle or change in some given parameters.
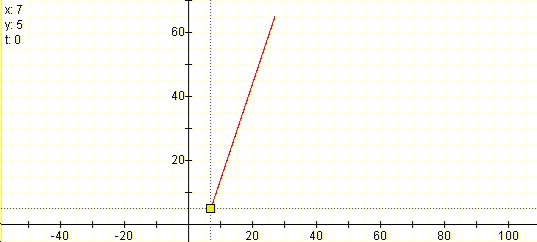
I will like you to observe how parametric equations are used to show
the link between the following two graphs that represent the graphs
of an object dropped 25 feet above the ground. The problem is to determine
the time it takes the object to hit the ground.
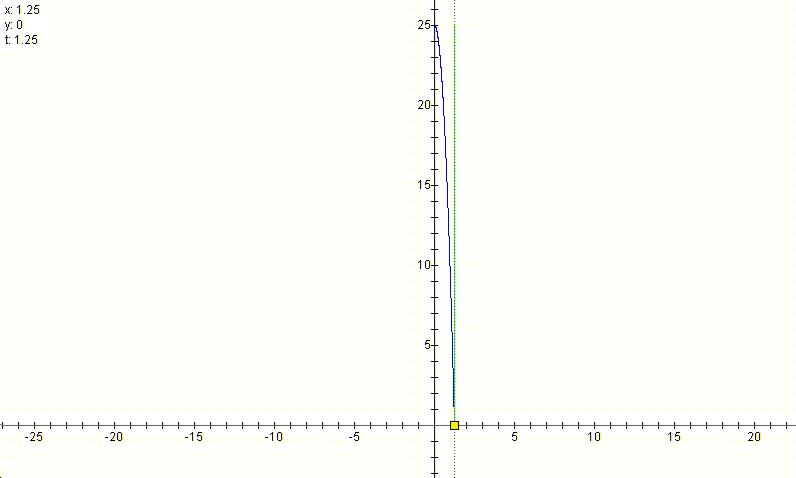
The graph in blue shows the relationship between the time traveled
and the height of the object.
The graph in green shows the visual aspect or the movement of the object.
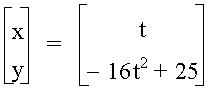
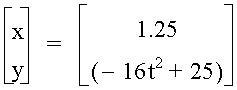
To see the animation of the movement , use the graphing calculator
TI 83 to graph the following equation:
![]()
![]()
![]()
![]()
Set your window appropriately and graph in simultaneous mode.