The Department of Mathematics Education


 ASSIGNMENT 12

Presented by Godfried Lawson


The Spreadsheet in Mathematics Explorations

The spreadsheet is a utility tool that can be adapted to many different explorations, presentations, and simulations in mathematics. There are spreadsheets available on almost any platform. An essential feature should be the ability to make graphs and charts from the matrix of data.


 I will use the following exploration to generate a function to predict observed data.

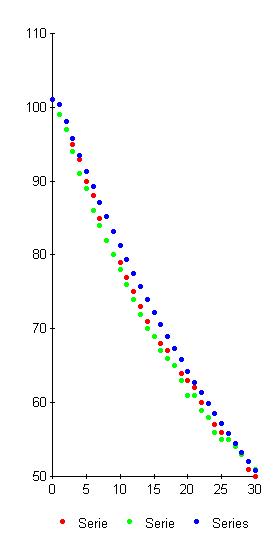
The data below are collected by my upward bound students at the Morris Brown College chemistry laboratory.


                    Time                   Temperature                 Temperature              Theoretical
                                             Groupe #1                    Group #2                    Temperatue
                    0                           101                               101                             101
                    1                           99                                  99                              100.354
                    2                           97                                  97                                98.02679074
                    3                           95                                  94                                95.75354946
                    4                           93                                  91                                93.53302465
                    5                           90                                  89                                91.36399381
                    6                           88                                  86                                89.245262797
                    7                           85                                  84                                87.17566515
                    8                           82                                  82                                85.15406147
                    9                           80                                  80                                83.17933879
                  10                           79                                  78                                81.25040992
                  11                           77                                  76                                79.36621292
                  12                           75                                  74                                77.52571044
                  13                           73                                  72                                75.72788921
                  14                           71                                  70                                73.97175946
                  15                           69                                  69                                72.25635436
                  16                           68                                  67                                70.5807295
                  17                           67                                  66                                68.94396239
                  18                           65                                  65                                67.3451519
                  19                           64                                  63                                65.78341783
                  20                           63                                  61                                64.25790037
                  21                           62                                  61                                62.76775966
                  22                           60                                  59                                61.31217531
                  23                           58                                  58                                59.89034596
                  24                           57                                  56                                58.50148884
                  25                           56                                  55                                57.14483932
                  26                           55                                  55                                55.81965049
                  27                           54                                  54                                54.52519286
                  28                           53                                  53                                53.26075358
                  29                           51                                  52                                52.0256367
                  30                           50                                  51                                50.81916219

Below is the graph of the collected data ( red and green ) and the theoretical data ( blue )
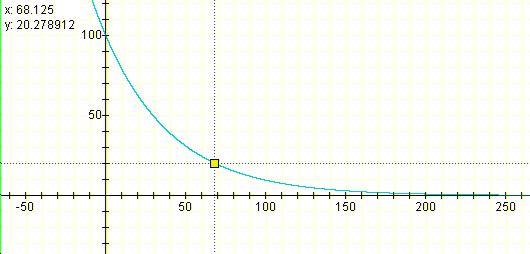

y =

Based on the graph obtainded from both data, I can conclude that the data  described an exponentional decay.
Using Ti-83 calculator, I constructed the exponential regression.
Using this equation one can predict the water temperature at any time until the temperature reaches room temperature.

.


Return