IMAGINARY AND COMPLEX NUMBERS
Presented by
Godfried Lawson
Origin of the imaginary unit

Square roots of positive real numbers lead us to the study of rational
and irrational
numbers. By including the imaginary square roots of negative numbers,
we can build a
new field of complex numbers.
In the sixteenth century, the Italian mathematician and physician Girolamo
Cardano
offered the “fictitious” solutions
and
to the problem of finding two numbers with a sum of 10 and a product
of 40.
Sum:
( 5 + sqrt(-15) ) + ( 5 - sqrt(-15) ) = 5 + 5 + sqrt (-15) -
sqrt(-15) = 10
Product:
( 5 + sqrt(-15) ) ( 5 - sqrt(-15) = 5*5 - 5*sqrt(-15) + 5 *sqrt(-15) - (-15) = 25 = 15 = 40
By using square roots of negative real numbers. such as sqrt(-15), Cardano
had invented
a new type of number not in the real number system. These numbers came
to be known
as imaginary number is a number of the form bi, where b is a real number.
The imaginary unit i is defined by i = sqrt(-1) and satisfies the equation
i^2 = -1
An imaginary number is a number of the form bi , where b is a
real number.
The complex numbers consist of all sums a + bi, where a and b
are real
numbers. The real part of a + bi is a , and imaginary part is
bi.
GRAPHING COMPLEX NUMBERS
You will see how the complex numbers can be graphed in a plane.
the beautiful images of fractal geometry are graphs of sets of complex
numbers graphed
in the complex plane, sometimes called the Argand plane.
the method of graphing complex numbers was developed independently
about two
centuries ago by Carl Friedrich Gauss (1777-1855), Caspar wessel (1745-1818),
and Jean
Robert Argand (1768-1822).
the complex plane has a horizontal real axis. and a vertical imaginary
axis.
A complex number a + bi is graphed in the complex plane as the point
with coordinates
(a, b).
Using the Pythagorean Theorem, the distance from 4 - 3i to the origin is 5.
The Pythagorean Theorem shows that, in general
One rich family of fractal images is called Julia sets, named for Gaston
Julia, a
twentieth century French mathematician. The key to finding these sets
is iteration.
Iteration is the process of repeatedly substituting the previous output
value of a function,
the iterate, back into the function to obtain a new iterate, This feedback
process begins
with an initial value.
Let generate a fractal by iterating the complex function :
f(Z) = z^2 - 0.76909 + 0.10436i for thousands of
complex initial values.
To see how iteration works, use the initial value z = 0.1- 0.02i and
give f(z).
Then give the next two iterates.
Why Teaching Fractals?
I want to complete this essay by adding some reasons why we must teach
fractals in classroom.
According to Jeanne Rast, the visual, experimental nature of fractals
fosters student exploration.
Fractals connect traditional geometry with the current domain of geometry
research. They are applicable to many areas of science . Studying fractals
challenges visual thinking skills and reasoning skills of students. Fractals
support concepts of iteration and pattern as well as a computer based environment.
Famous Fractals and Their Use in the Classroom
Famous fractals include Sierpinsky Triangle, the Mandlebrot Set, the julia set, the koch Snowflake and the Dragon Curve. The following activities with fractals are appropriate for students in grades 6-10. They may be used when teaching a geometry unit or course and could be incorporated with the concepts of similarity, equilateral triangles or constructions. The activities may also be used separately as math labs or exploratory. the topics may be assigned to groups of students as research projects. students enjoy the activities and they promote student's enthusiasm for mathematics.
Materials needed for the Sierpinski Triangle activity are dot paper and rulers. For the Pascal Triangle, triangular grid paper is needed. A ruler and blank paper is all that is needed for the koch Curve. For the koch Snowflake triangle grid paper is needed, It is helpful to do the constructions on the overhead with younger students, or let students work in groups as the teacher walks around the room facilitating.
Fractals and the Sierpinski Tiangle
DATA TABLE
ITERATION (STEP)
# OF EQUILATERAL TRIANGLES# OF UNSHADED TRIANGLES 1 . 2 . 3 . 4 . 5 . Directions:
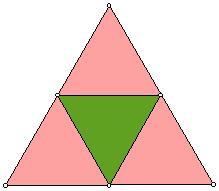
1. On the dot paper, use a ruler to make an equilateral triangle. Start at the top.
2. Connect the midpoints of each side of the triangle.
3. Color in the triangle in the center.
4. Fill in the data chart to show how many equilateral triangles you now have ( count all sizes) and how
many unshaded triangles you have.
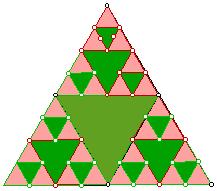
5. Find the mid points of the triangles tat are left uncolored and joint thoses midpoints
6. Color in the triangles in the center.
7. Fill in the data chart to show how many equilateral triangles you now have and haw many shaded triangles
there are.
8. Repeat.


Click HERE to see the GSP sketch of the above construction and HERE for the script.