Modifying the
slope and y-intercept of a linear function.
Kim Seay
EMAT6680
A linear function (a function
that graphs as a line) can be written in the form
f(x)
= mx+b where m and b are real
numbers.
Modifying the
slope
Since m and b can be any
real numbers, let's suppose that m = 3 and b = 0.
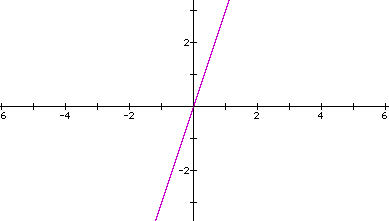
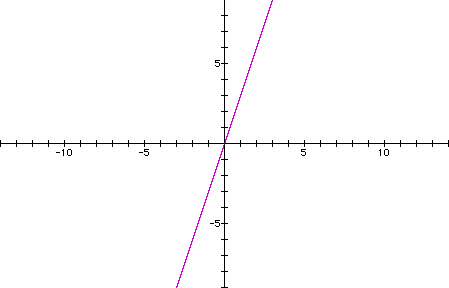
The graph of the equation
f(x) = 3x + 0 would look like this:
 If x is fixed, what happens
to the value of f(x) as m changes?
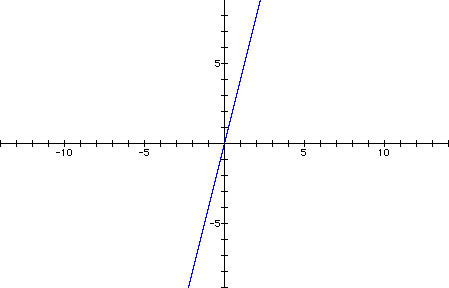
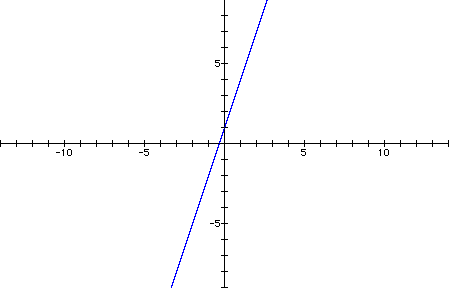
If we increase m by one,
the equation becomes f(x) = 4x + 0 and the graph becomes
If x is fixed, what happens
to the value of f(x) as m changes?
If we increase m by one,
the equation becomes f(x) = 4x + 0 and the graph becomes
 The graph appears to have
a steeper slope.
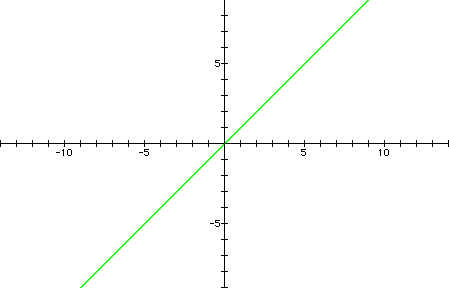
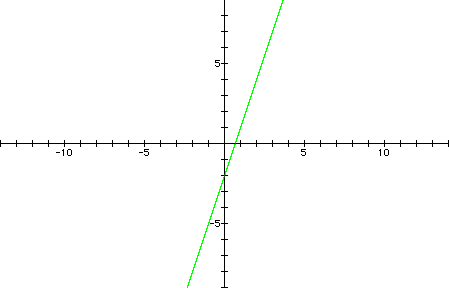
Let's try using a smaller
m value such as 1.
The graph appears to have
a steeper slope.
Let's try using a smaller
m value such as 1.
 In order to compare the
changes we are seeing in m, let's graph all three functions on
the same graph.
In order to compare the
changes we are seeing in m, let's graph all three functions on
the same graph.
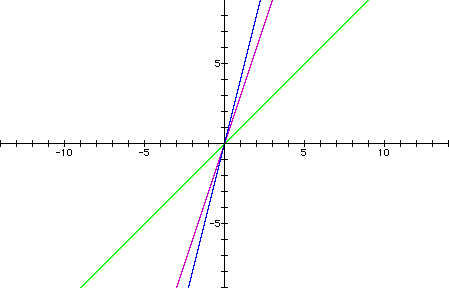 It seems
as if the graph is getting steeper when m increases and flatter
as m decreases. In order to investigate this further (and try
out some negative m values), let's see what happens as m changes
from -10 to 10.
Click
here.
Click
here to see m values of -100 to 100.
It seems
as if the graph is getting steeper when m increases and flatter
as m decreases. In order to investigate this further (and try
out some negative m values), let's see what happens as m changes
from -10 to 10.
Click
here.
Click
here to see m values of -100 to 100.
In the function f(x) = mx
+b , the change in m value (while x is constant) affects the slope
of the graph. While m is positive, the graph of the function will
become steeper as m increases in value. As m decreases, the graph
becomes flatter as it approaches zero and forms a horizontal line
(through b) when m=0. When m takes on negative values, the graph
starts to fall from the opposite direction. Hence, the graph is
now going through quadrants 2 and 4 as opposed to 1 and 3. The
greater the negative values for m, the steeper the decline of
the graph.
Modifying the
y-intercept
Now let's look at changes
in b. Going back to our original equation f(x)=3x+0 whose graph
looks like this:
 If we increase b by one
to form the equation f(x)=3x+1, the y-intercept of the line changes
from the point (0,0) to (0,1).
If we increase b by one
to form the equation f(x)=3x+1, the y-intercept of the line changes
from the point (0,0) to (0,1).
 Let's try decreasing the
b value to -2.
Let's try decreasing the
b value to -2.
 As you might have guessed,
the y-intercept takes on a value of -2; therefore, the graph of
the function crosses the y axis at -2. We can try this with a
slider value for b ranging from -10 to 10.
Click
here to see this.
You can see that as n (or
b) changes values, the y-intercept changes accordingly.
We can try a greater range
for b to see if the same thing happens.
Click
here to see b values of -100 to 100.
The same thing is happening.
The b value corresponds with the y-intercept of the function..
As you might have guessed,
the y-intercept takes on a value of -2; therefore, the graph of
the function crosses the y axis at -2. We can try this with a
slider value for b ranging from -10 to 10.
Click
here to see this.
You can see that as n (or
b) changes values, the y-intercept changes accordingly.
We can try a greater range
for b to see if the same thing happens.
Click
here to see b values of -100 to 100.
The same thing is happening.
The b value corresponds with the y-intercept of the function..
Conclusion:
I think Graphing Calculator
is a wonderful tool for students to use to explore changes in
the slope and y-intercept of a linear equation. It is much more
effective for students to discover what happens to the values
of "m" and "b" as they vary on their own,
than to read about it in a textbook. I think some students go
through an entire course of Algebra without having a clear concept
of what slope and y-intercept are. I think this is an excellent
way to help with that.
Return
