

In this write-up, I first use the parametric equations x = acos(t) and y = bsin(t), where 0 < t < 6.28. I examine the graphs of these equations when a = b, a < b, and a > b. Then I move on to the parametric equations x = acos(t) + hsin(t) and y = bsin(t) + hcos(t), where 0 < t < 6.28, and I examine the graphs when a = b, a < b, and a > b.
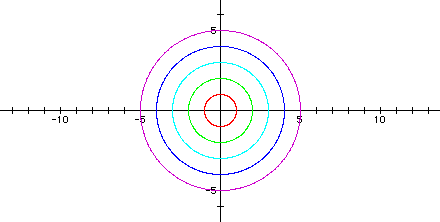
The following graph shows a = b = 1, a = b = 2, a = b = 3, a = b = 4, and a = b = 5.
The following graph shows a = b = -1, a = b = -2, a = b = -3, a = b = -4, and a = b = -5.
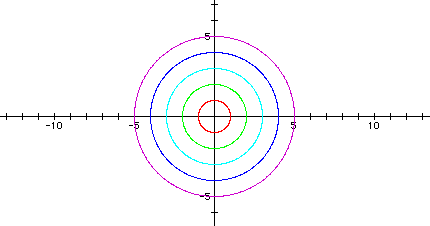
Notice that the graphs are all circles. Each graph crosses the x-axis and the y-axis at +/- a and +/-b. Putting a negative on the a and b in the equation does not change the second group of graphs from the first group; for example, the graph when a = b = 1 is the same as the graph when a = b = -1.
Thus, I conclude that when | a | = | b |, the graph of the parametric equations in the form x = acos(t) and y = bsin(t) gives circles centered at the origin, with radii = | a | = | b |.
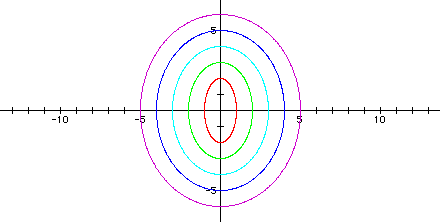
The following graph shows a = 1 < b = 2, a = 2 < b = 3, a = 3 < b = 4, a = 4 < b = 5, and a = 5 < b = 6 (Note in each case, a = b - 1).
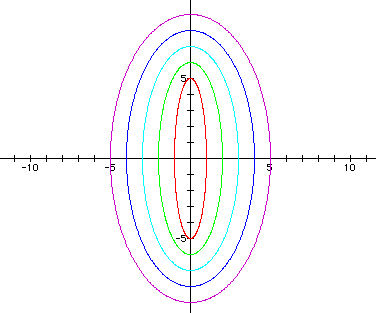
The following graph shows a = 1 < b = 5, a = 2 < b = 6, a = 3 < b = 7, a = 4 < b = 8, and a = 5 < b = 9 (Note in each case, a = b - 4).
The following graph shows a = -5 < b = 1, a = -4 < b = 2, a = -3 < b = 3, a = -2 < b = 4, and a = -1 < b = 5 (Note in each case, a = b - 6).
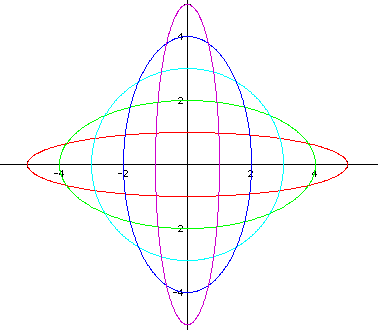
Notice that the graphs are all ellipses.
Based on the first two examples, I would conjecture that each graph crosses the x-axis at +/- a and the y-axis at +/- b. Each graph has its center at the origin. So when a < b, it seems that the major axis lies on the y-axis, and the minor axis lies on the x-axis. But in the third example, there exist some negative values of a in the equations. In this case, the ellipses do not all have major axes on the y-axis and minor axes on the x-axis. So I must revisit my assumption.
It seems that the negative has no bearing on where the major and minor axes lie. In other words, when a = -5 and b = 1, although a < b, I know that | a | > | b |. Therefore, this graph does not have a major axis on the y-axis like the previous examples, but rather has a major axis on the x-axis instead. Also, when a = -3 and b = 3, although a < b, I know that | a | = | b |, and so this graph is a circle.
Thus, I need to make my conjecture more specific. I conclude that when | a | < | b |, the graph of the parametric equations in the form x = acos(t) and y = bsin(t) give ellipses centered at the origin, with a major axis on the y-axis and the minor axis on the x-axis.
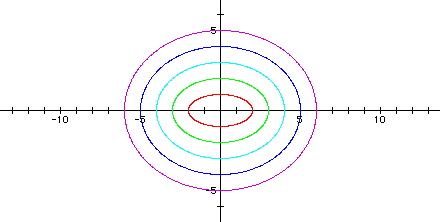
The following graph shows a = 2 > b = 1, a = 3 > b = 2, a = 4 > b = 3, a = 5 > b = 4, and a = 6 > b = 5 (Note in each case, a = b + 1).
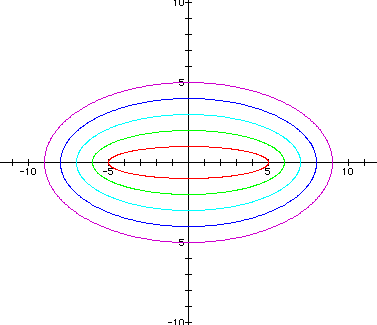
The following graph shows a = 5 > b = 1, a = 6 > b = 2, a = 7 > b = 3, a = 8 > b = 4, and a = 9 > b = 5 (Note in each case, a = b + 4).
The following graph shows a = 1 > b = -5, a = 2 > b = -4, a = 3 > b = -3, a = 4 > b = -2, and a = 5 > b = -1 (Note in each case, a = b + 6).
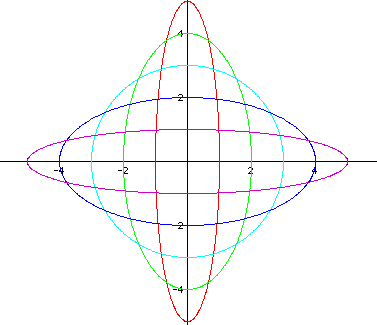
Notice that the graphs are all ellipses.
Based on the first two examples, I would conjecture that each graph crosses the x-axis at +/- a and the y-axis at +/- b. Each graph has its center at the origin. So when a > b, it seems that the major axis lies on the x-axis, and the minor axis lies on the y-axis. But in the third example, there exist some negative values of b in the equations. Now the ellipses do not all have major axes on the x-axis and minor axes on the y-axis. So I must revisit my assumption.
It seems that the negative has no bearing on where the major and minor axes lie. In other words, when a = 1 and b = -5, although a > b, I know that | a | < | b |. Therefore, this graph does not have a major axis on the x-axis like the previous examples, but rather has a major axis on the y-axis instead. Also, when a = 3 and b = -3, although a > b, I know that | a | = | b |, and so this graph is a circle.
Thus, I need to make my conjecture more specific. I conclude that when | a | > | b |, the graph of the parametric equations in the form x = acos(t) and y = bsin(t) give ellipses centered at the origin, with a major axis on the x-axis and the minor axis on the y-axis.
The following graph shows a = b = 2, and h = -2, h = -1, h = 0, h = 1, and h = 2.
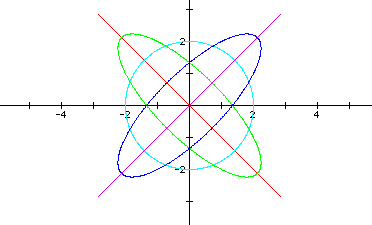
Click here to see a movie of the parametric equations x = 2cos(t) + hsin(t) and y = 2sin(t) + hcos(t) as h varies from -10 to 10 and back.
I conjecture that the graphs can be a line, a circle, or an ellipse.
When | h | = a or | h | = b, the parametric equation graphs as a line.
When h = 0, the parametric equation graphs as a circle (in this case, the equation reduces to x = a cos(t) and y = bsin(t), with | a | = | b |, as previously discussed).
In all other cases, the parametric equation seems to graph as an ellipse with the center at the origin. When h is negative, the ellipse has a major axis with a negative slope, and when h is positive, the ellipse has a major axis with a positive slope.
The following graph shows a = 2 < b = 5, and h = -2, h = -1, h = 0, h = 1, and h = 2.
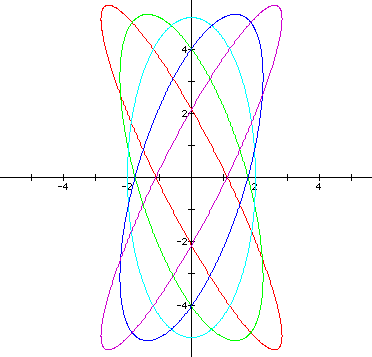
Click here to see a movie of the parametric equations x = 2cos(t) + hsin(t) and y = 5sin(t) + hcos(t) as h varies from -10 to 10 and back.
I conjecture that the graphs are ellipses with the center at the origin. When h is negative, the ellipse has a major axis with a negative slope, and when h is positive, the ellipse has a major axis with a positive slope. When h = 0, the ellipse has a major axis that coincides with the y-axis (in this case, the equation reduces to x = a cos(t) and y = bsin(t), with | a | < | b |, as previously discussed).
The following graph shows a = 4 > b = 2, and h = -2, h = -1, h = 0, h = 1, and h = 2.
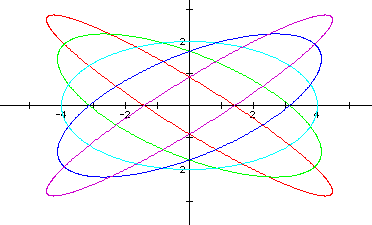
Click here to see a movie of the parametric equations x = 4cos(t) + hsin(t) and y = 2sin(t) + hcos(t) as h varies from -10 to 10 and back.
I conjecture that the graphs are ellipses with the center at the origin. When h is negative, the ellipse has a major axis with a negative slope, and when h is positive, the ellipse has a major axis with a positive slope. When h = 0, the ellipse has a major axis that coincides with the x-axis (in this case, the equation reduces to x = a cos(t) and y = bsin(t), with | a | > | b |, as previously discussed).