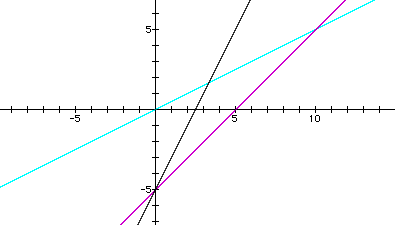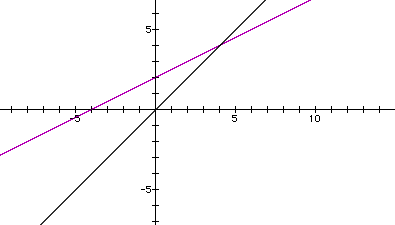

In this write-up, I examine the graphs of the sum, product, quotient, and composite functions of pairs of linear functions. I examine each operation individually and ask: 1) what does the equation of the new function look like, 2) what does the graph of the new function look like, 3) how does the graph of the new function gets its characteristics from the original pair of linear functions, 4) if the new graph is not a linear function, does the graph of the new function ever graph linearly, and, if so, what would the original linear functions have to look like to make that happen, and 5) what other information can I deduce.
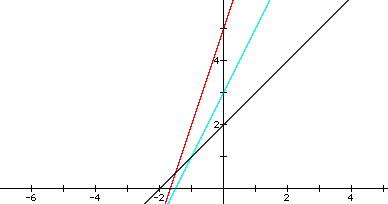
Note: In this section, let f(x) = m1x + b1 and g(x) = m2x + b2 be the original linear functions (where f(x) and g(x) do not graph as the same line), and let s(x) = f(x) + g(x). In all of the graphs in this section, f(x) is black, g(x) is turquoise, and s(x) is red.
The sum function, s(x) = f(x) + g(x) = (m1x + b1) + (m2x + b2) = (m1 + m2)x + (b1 + b2). Since this function equation can be written in linear form, the graph of s(x) is ALWAYS another line.
The characteristics of a line are its slope and its y-intercept. From the equation of s(x), I can see that the slope of s(x) is the sum of the slopes of f(x) and g(x), or m1 + m2. The y-intercept of s(x) is the sum of the y-intercepts of f(x) and g(x), or b1 + b2.
The following graph is an example. Here, f(x) = x + 2 and g(x) = 2x + 3. Therefore, the slope of s(x) = 1 + 2 = 3, and the y-intercept of s(x) = 2 + 3 = 5. So, the equation of this sum function is s(x) = 3x + 5.
By analyzing the equation s(x) = (m1 + m2)x + (b1 + b2), I can also state the following:
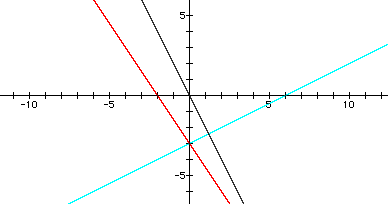
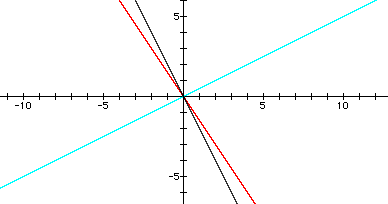
1) It can be seen that the only times s(x) has the same slope as an original linear function, and is therefore parallel to it, is:
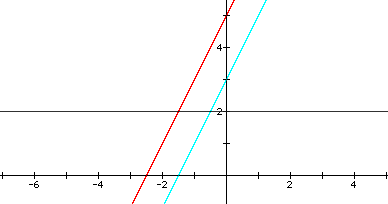
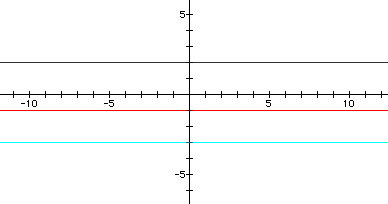
2) It can be seen that the only times s(x) has the same y-intercept as an original function is:
Note: In this section, let f(x) = m1x + b1 and g(x) = m2x + b2 be the original linear equations (where f(x) and g(x) do not graph as the same line), and let p(x) = f(x)*g(x). In all of the graphs in this section, f(x) is black, g(x) is turquoise, and p(x) is green.
The product function, p(x) = f(x)*g(x) = (m1x + b1)*(m2x + b2) = m1m2x2 + m1b2x + m2b1x + b1b2 = (m1m2)x2 + (m1b2 + m2b1)x + (b1b2). Therefore, the product is a quadratic equation, and so the graph of p(x) is (usually) a parabola.
The characteristics of a parabola are its x-intercepts, its y-intercept, its axis of symmetry, its vertex, and whether it opens up or down. From the equation of p(x), the y-intercept of the parabola is the product of the y-intercepts of the original linear functions (since x = 0 for the y-intercept, I substitute this into the p(x) equation and get p(x) = b1b2). Also, the x-intercepts of the parabola are the x-intercepts of each of the original linear functions (since y = 0 for the x-intercept, I substitute this into the p(x) equation and get 0 = (m1x + b1)*(m2x + b2); solving for x gives one x-intercept the same as the x-intercept of f(x) and the other the same as the x-intercept of g(x)). The parabola's axis of symmetry can be found by averaging the x-coordinates of the x-intercepts; in general, x = [(- b1 / m1) + (- b2 / m2)] / 2 = (- b1m2 - b2m1) / 2m1m2. The vertex can be found by plugging this value for x into the original equation and solving for y. So, y = {m1[(- b1m2 - b2m1) / 2m1m2] + b1}*{m2[(- b1m2 - b2m1) / 2m1m2] + b2} = (b1m2)2 + 2b1b2m1m2 + (b2m1)2. Therefore, the vertex is ([(- b1m2 - b2m1) / 2m1m2] , [(b1m2)2 + 2b1b2m1m2 + (b2m1)2]). Finally, whether the graph opens up or down depends on the sign of the squared term of p(x) - if m1m2 is positive or negative. Obviously, if m1 and m2 have the same sign, then the product is positive, and so the graph opens up. If m1 and m2 have different signs, then the product is negative, and so the graph opens down.
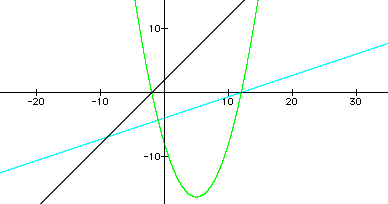
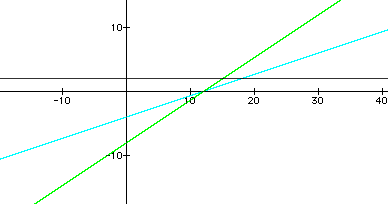
The following graph is an example. Here, f(x) = x + 2 and g(x) = (1/3)x - 4. Therefore, the y-intercept of the parabola is 2*(-4) = 8 and the x-intercepts are x = -2 / 1 and x = -(-4) / (1/3), or x = -2 and x = 12. The axis of symmetry is the vertical line x = (-2 + 12) / 2 = 5. The vertex can be found by substituting 5 for x into the product equation: y = (5 + 2)*[(1/3)*5 - 4] = -49 / 3; therefore, the vertex is (5 , -49 / 3). Finally, since 1 and (1/3) are both positive, their product is positive, and so the graph opens up. So, the equation of this product function is p(x) = (1/3)x2 - (10/3)x - 8.
The following graph is another example. Here, f(x) = -x + 5 and g(x) = (1/2)x + 3. Therefore, the y-intercept of the parabola is 5*3 = 15 and the x-intercepts are x = -5/ -1 and x = (-3) / (1/2), or x = 5 and x = -6. The axis of symmetry is the vertical line x = (5+ -6) / 2 = (-1/2). The vertex can be found by substituting (-1/2) for x into the product equation: y = [-(-1/2) + 5]*[(1/2)*(-1/2) + 3] = 121 / 8; therefore, the vertex is (-(1/2) , 121 / 8). Finally, since -1 is negative and 1/2 is positive, their product is negative, and so the graph opens down. So, the equation of this product function is p(x) = (-1/2)x2 - (1/2)x + 15.
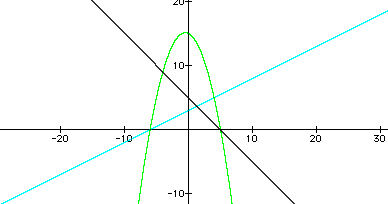
For the product function to be linear, then the x2 term cannot exist. The only way to make this happen is for the coefficient of the x2 term be equal to zero. In other words, m1m2 must equal zero. Well, this product can occur in one of two ways: 1) either m1 = 0 or m2 = 0, or 2) both m1 and m2equal zero.
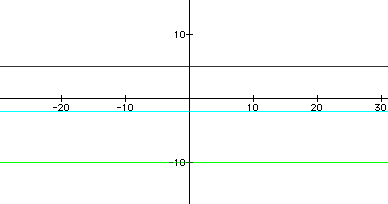
Note: In this section, let f(x) = m1x + b1 and g(x) = m2x + b2 be the original linear equations, and let q(x) = f(x)/g(x). In all of the graphs in this section, f(x) is black, g(x) is turquoise, and q(x) is blue.
The quotient function, q(x) = (m1x + b1) / (m2x + b2). This is a variation of the form xy = k, a rational function. Therefore, the graph of q(x) is (usually) a hyperbola.
The characteristices of a rational function of this kind are its vertical and horizontal asymptotes, and the "quadrants" (using the vertical and horizontal asymptotes as pseudo-axes) in which the two pieces of the graph lie. From the equation, the vertical asymptote can be found by setting the denominator, m2x + b2, equal to zero and solving for x. This method is the same as finding the x-intercept of g(x), so the vertical asymptote of the hyperbola will occur at the x-intercept of g(x), or x = - b2 / m2. The horizontal asymptote can be found by finding the limit of the product equation as x approaches infinity; this results in the equation y = m1 / m2. If the slope of f(x) is greater than the slope of g(x), or m1 > m2, then the hyperbola exists in "quadrants" II and IV. If the slope of g(x) is greater than or equal to the slope of f(x), or m2 >/= m1, then the hyperbola exists in "quadrants" I and III.
The following graph is an example. Here, f(x) = x + 5 and g(x) = (1/2)x + 3. Therefore, the vertical asymptote of the hyperbola is x = -3 / (1/2) = -6, and the horizontal asymptote is y = 1 / (1/2) = 2. Since 1, the slope of f(x), is greater than 1/2, the slope of g(x), the hyperbola exists in "quadrants" II and IV. So, the equation of this quotient function is q(x) = (x + 5) / [(1/2)x + 3].
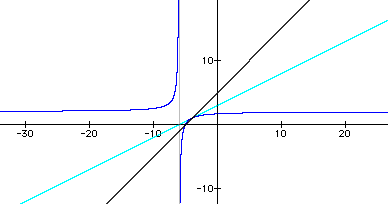
The following graph is another example. Here, f(x) = (1/2)x + 3 and g(x) = 2x - 2. Therefore, the vertical asymptote of the hyperbola is x = -(-2) / 2 = 1, and the horizontal asymptote is y = (1/2) / 2= 1/4. Since 2, the slope of g(x), is greater than 1/2, the slope of f(x), the hyperbola exists in "quadrants" I and III. So, the equation of this quotient function is q(x) = [(1/2)x + 3] / (2x - 2).
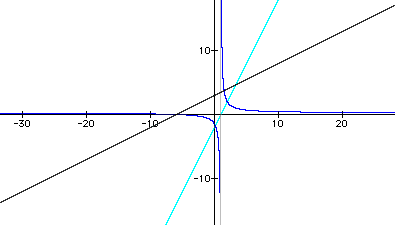
In order for the product function to become linear, q(x) cannot have an x term in the denominator. This means that the slope of g(x) must equal to zero, or m2 = 0, which also means g(x) would have to be a horizontal line. In this case, the equation of the quotient function becomes q(x) = (m1x + b1) / b2, or, written as a linear equation, q(x) = (m1/b2)x + (b1/b2).
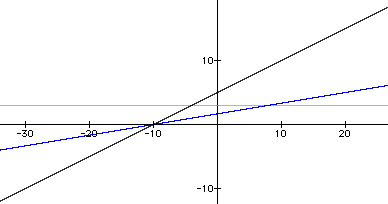
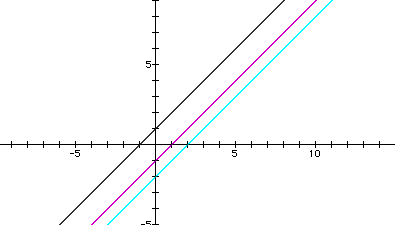
Note: In this section, let f(x) = m1x + b1 and g(x) = m2x + b2 be the original linear equations, and let c(x) = f(g(x)). In all of the graphs in this section, f(x) is black, g(x) is turquoise, and c(x) is purple.
The composite function, c(x) = f(g(x)) = m1(m2x + b2) + b1 = (m1m2)x + (m1b2 + b1). Since the equation of c(x) is of linear form, then the graph of the composite function of a pair of linear functions is ALWAYS another line.
The characteristics of a line are its slope and its y-intercept. From the equation of c(x), I can see that the slope of c(x) is the product of the slopes of f(x) and g(x), or m1m2. The y-intercept of c(x) is the product of the slope of f(x) and the y-intercept of g(x), plus the y-intercept of f(x), or m1b2 + b1.
The following graph is an example. Here, f(x) = -2x + 3 and g(x) = (1/2)x - 2. Therefore, the slope of c(x) = -2*(1/2) = -1, and the y-intercept of g(x) = -2*(-2) + 3 = 7. So, the equation of this composite function is c(x) = -x + 7.
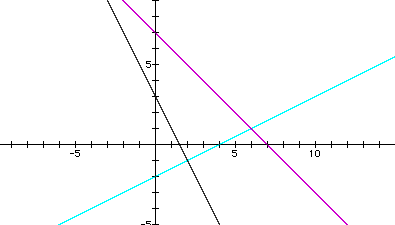
By analyzing the equation c(x) = (m1m2)x + (m1b2 + b1), I can also state the following:
1) It can be seen that the only times c(x) has the same slope as an original linear function, and is therefore parallel to it, is:
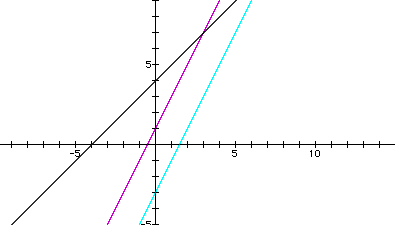
2) It can be seen that the only times c(x) has the same y-intercept as an original function is:
